Books and other online resources
Books
Data visualization books
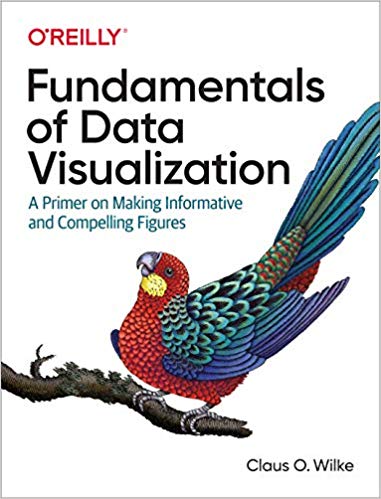
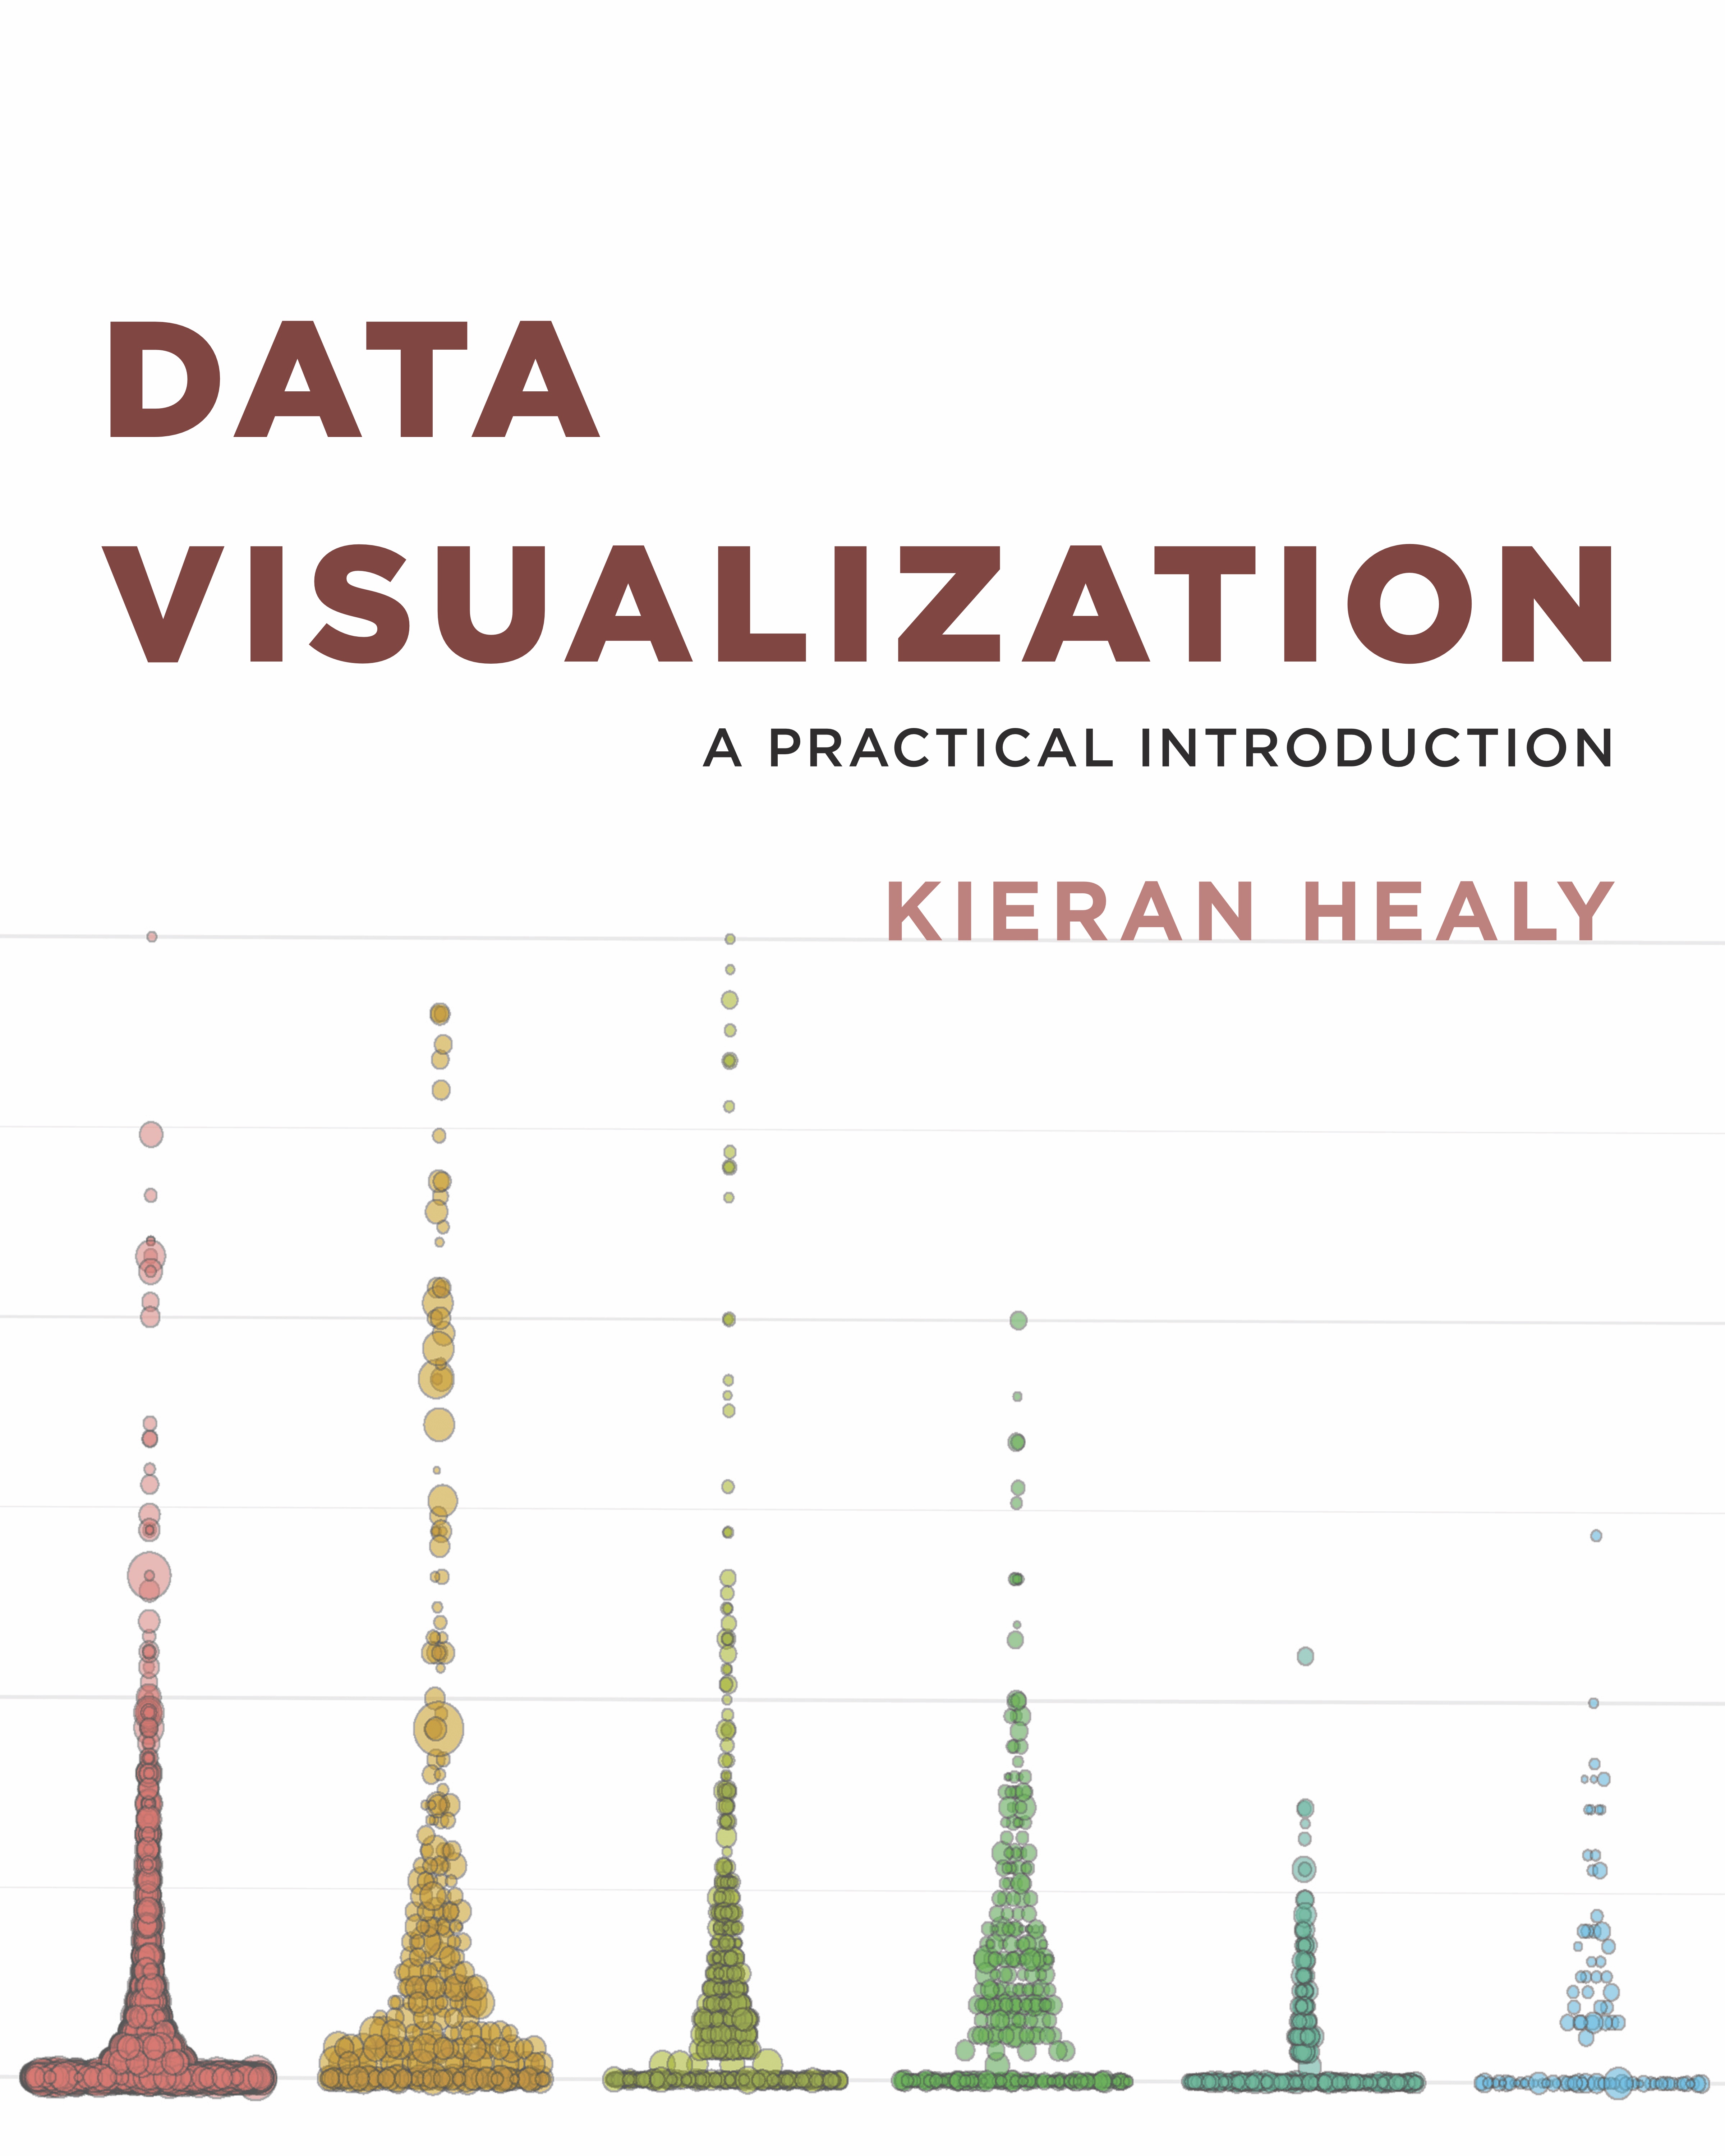
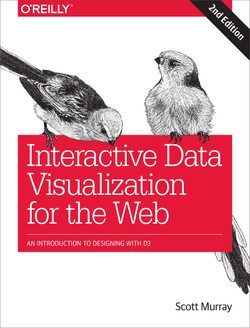
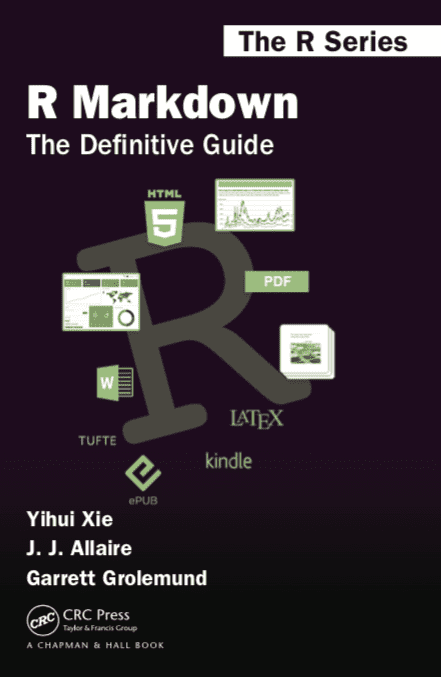
Clicking on the covers will send you to the free online versions of each book
The following books’ content are not available. The links are non-affiliate Amazon links to the books, or to the books’ web pages:
Toolkits
Non-online books. Some may be available at GU via Safari or other resources.
Writing and publishing
Of partcular interest to us will be chapters on HTML documents and HTML Presentations
Web references
Data visualization
- Flowing Data: This is one of our favorite sites for learning data viz. There are several tutorials in R for different graphics, as well as other languages. Nathan Yau, who runs the website, also has 2 excellent books on data viz, as well as a few self-guided courses for data viz in R.
- Flowing Data tutorials, with many in R
- JunkCharts: Critiques of chartjunk + junk art
- I want hue: Colors for data scientists
- BusinessPundit’s Guide to Infographics
- plotly reference: The plotly reference, that provides examples and code for various plot types using R. There are also interfaces for Python. There is a special section looking at converting
ggplot2graphics to plotly graphics.
Publishing
Javascript/Observable/Plotly
- Observable: A great site for learning about Javascript and D3. There are many examples of different types of graphics, and you can fork the code and modify it to see how it works. There are also many tutorials on how to use the site and how to create different types of graphics.
- Learning Observable, a series of 10 notebooks to get you started
- Observable and Javascript
- Observable for Python Users
- Plot for Matplotlib Users
