Lecture 9
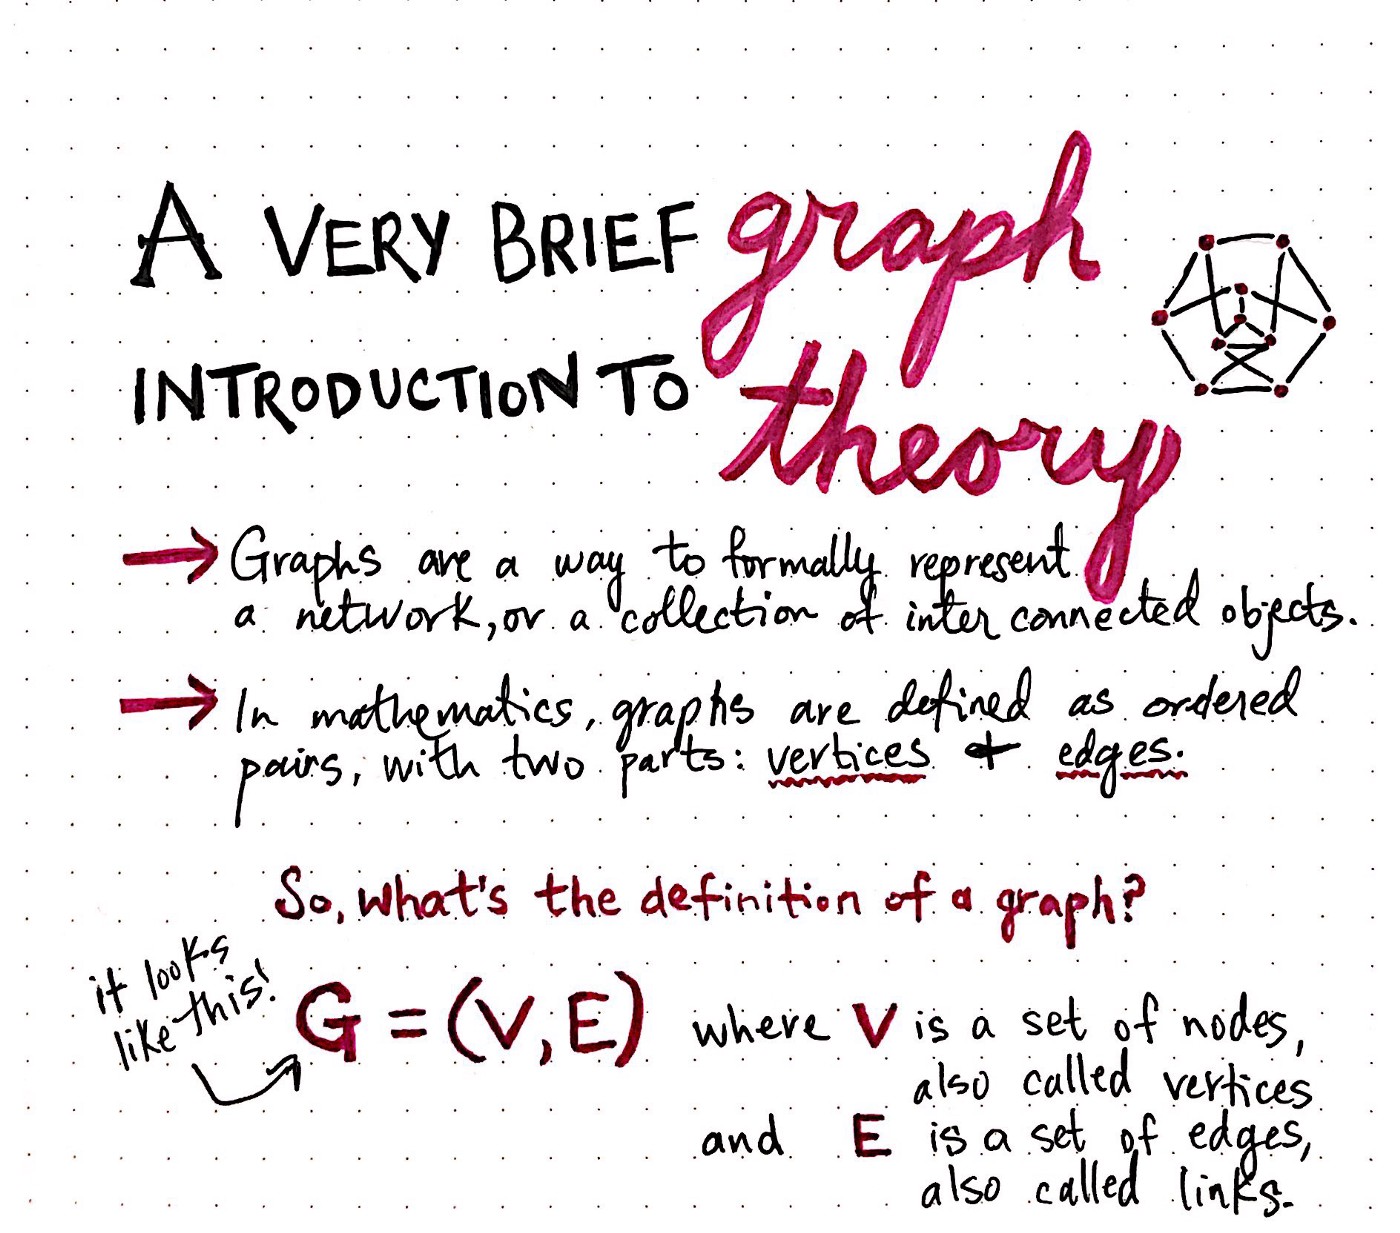
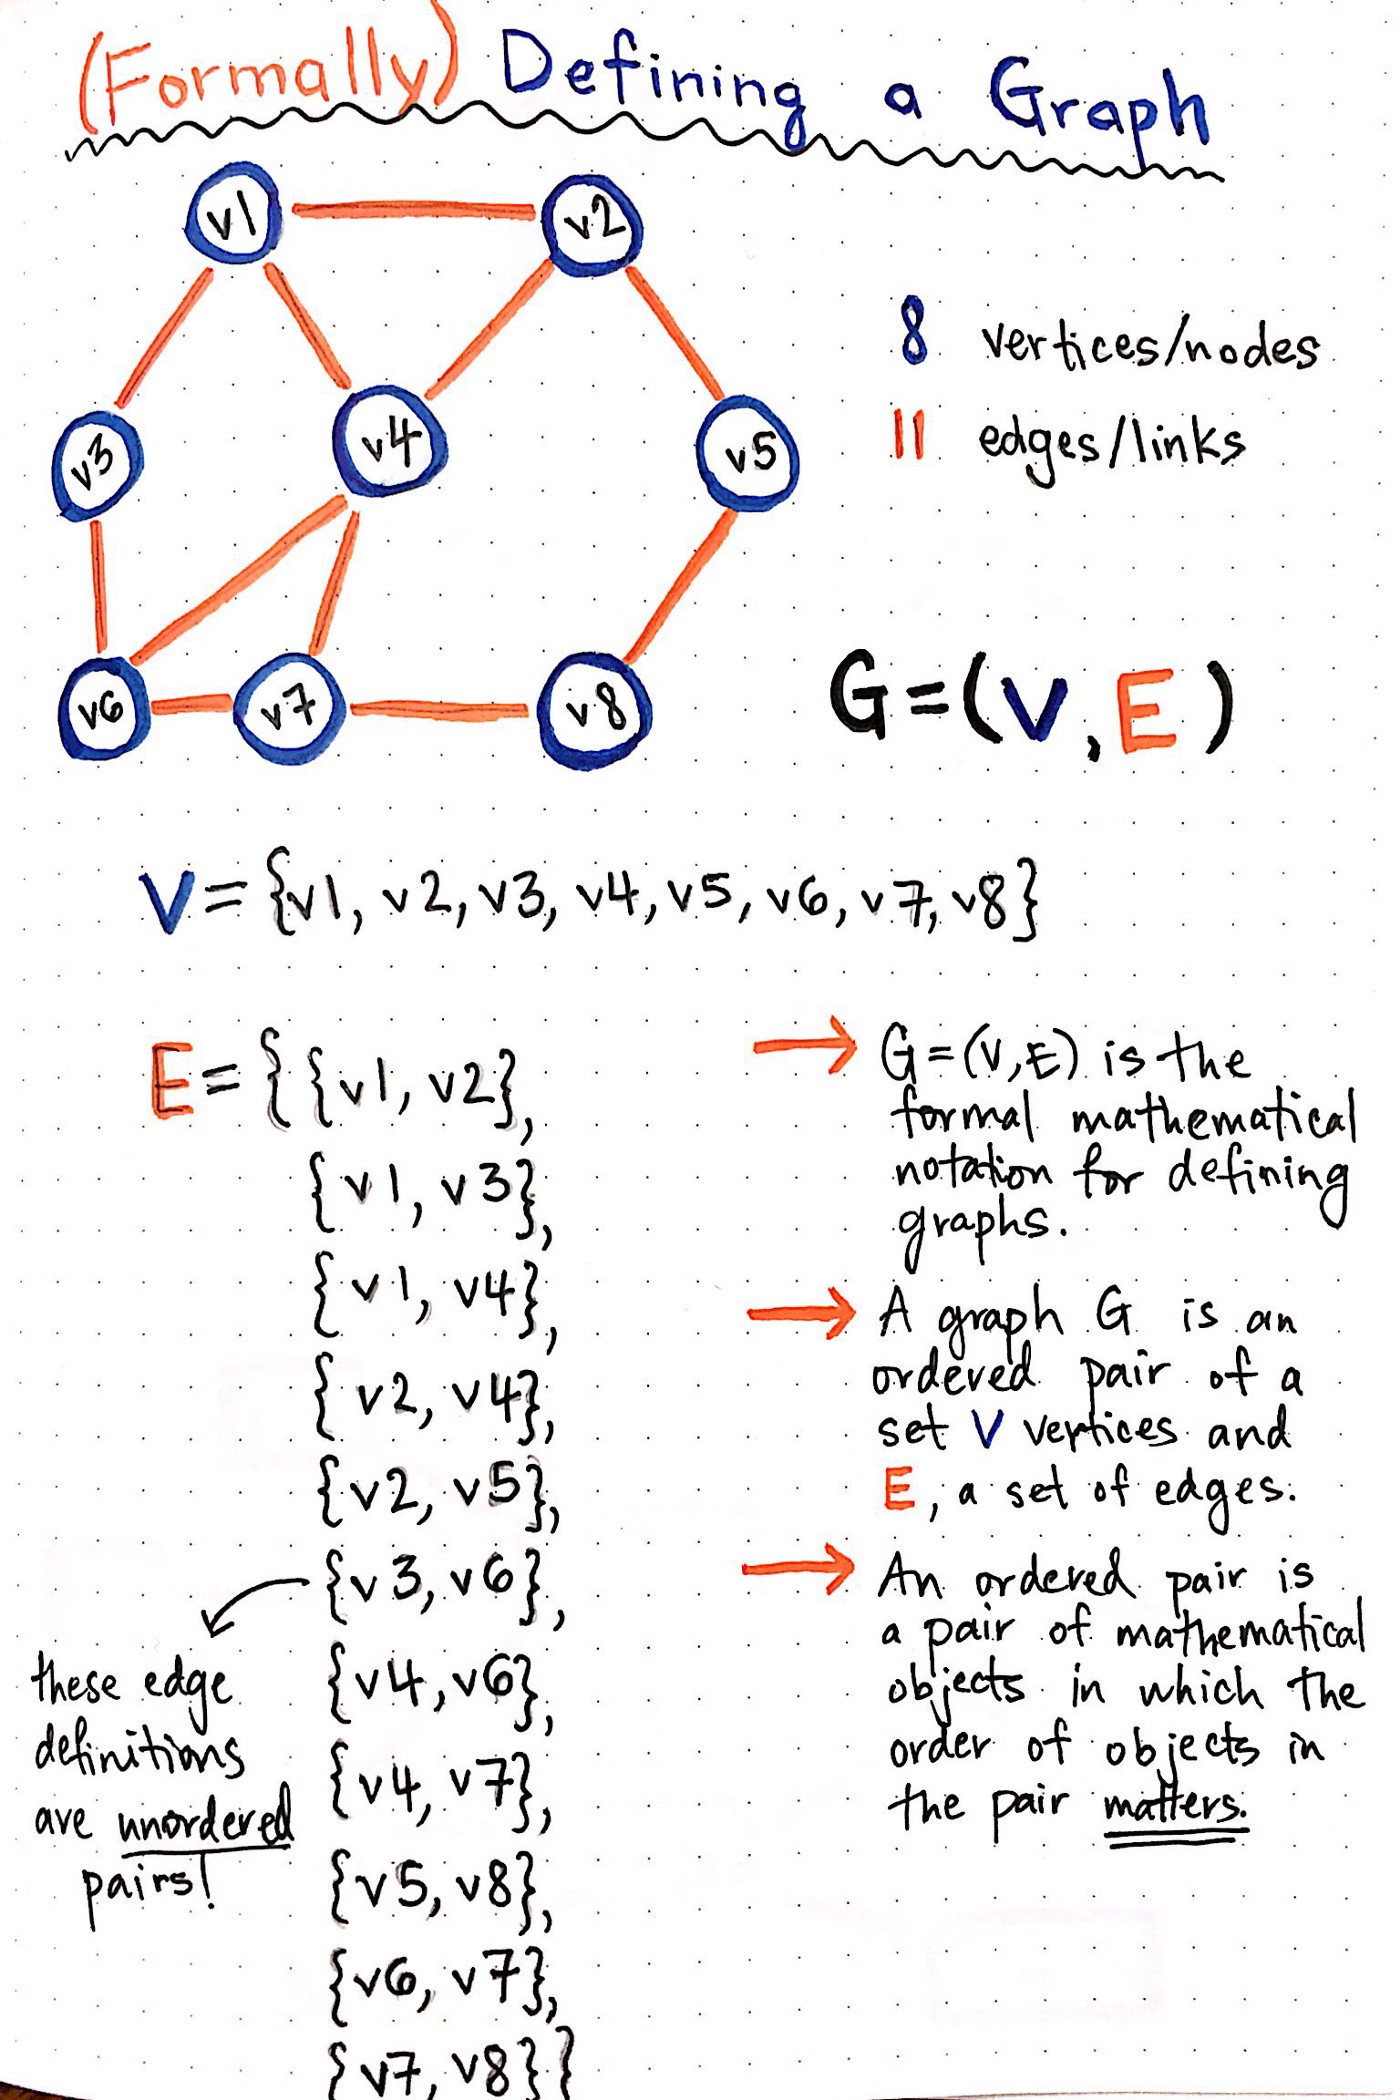
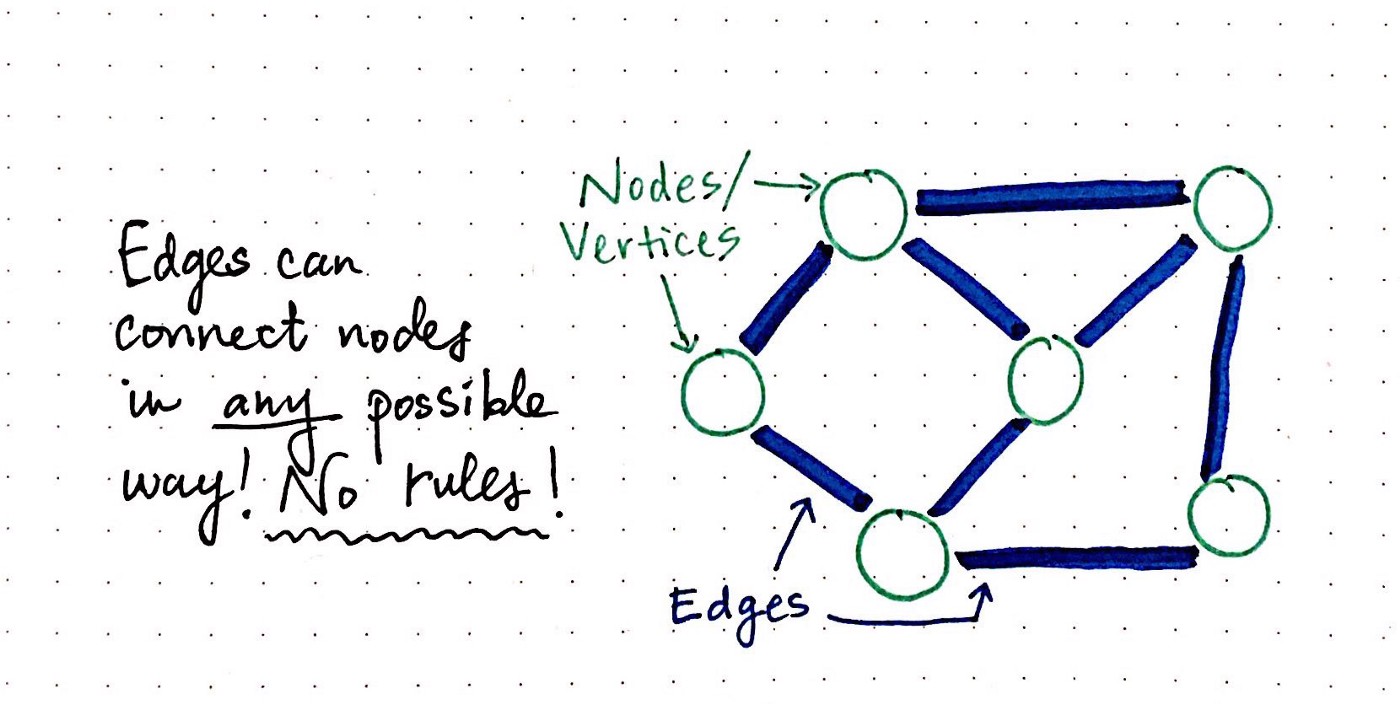
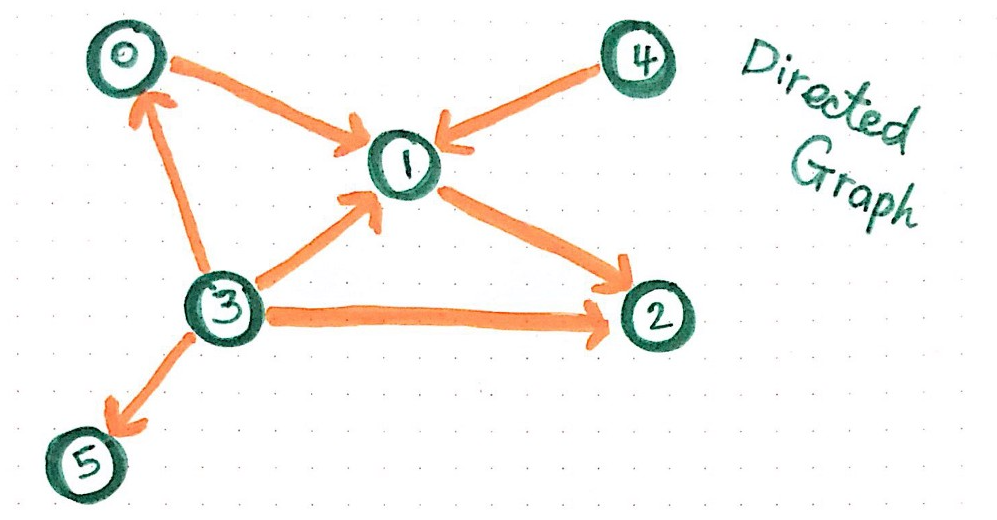
Visualizing relationships with networks, graphs and trees
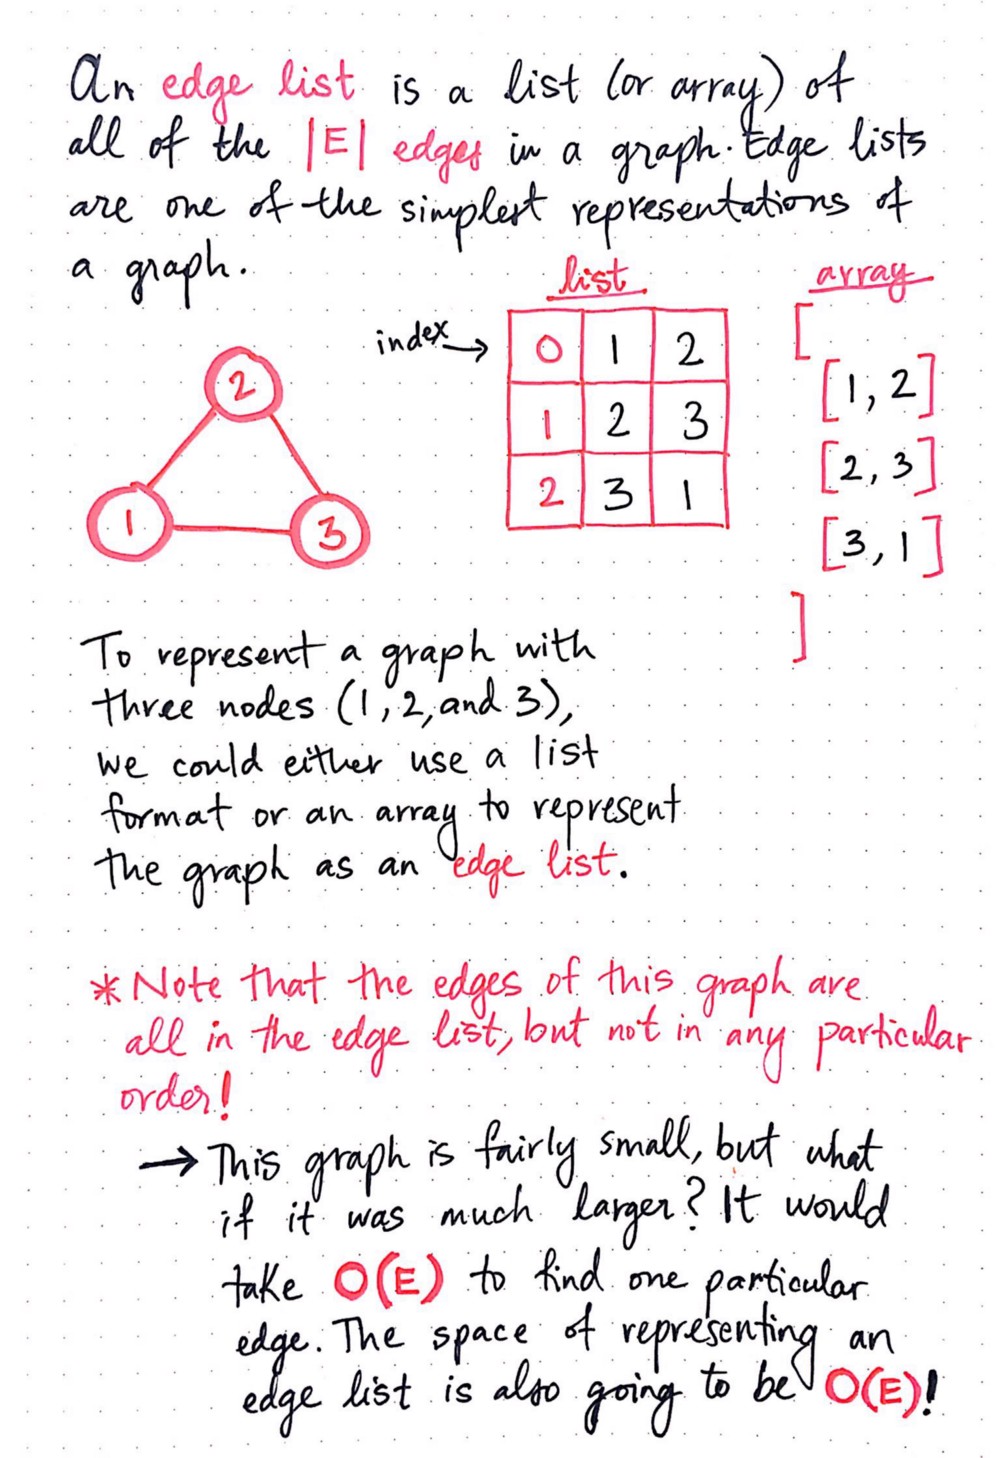
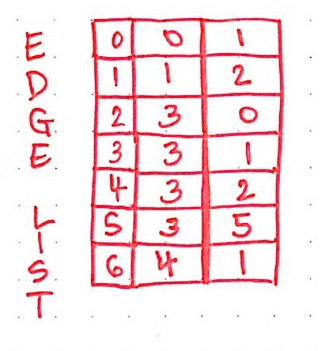
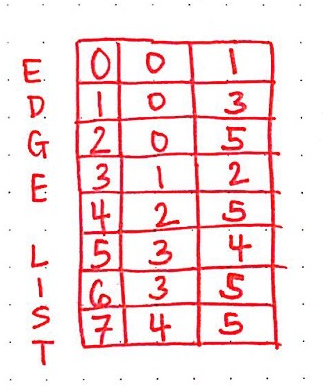
Edge List
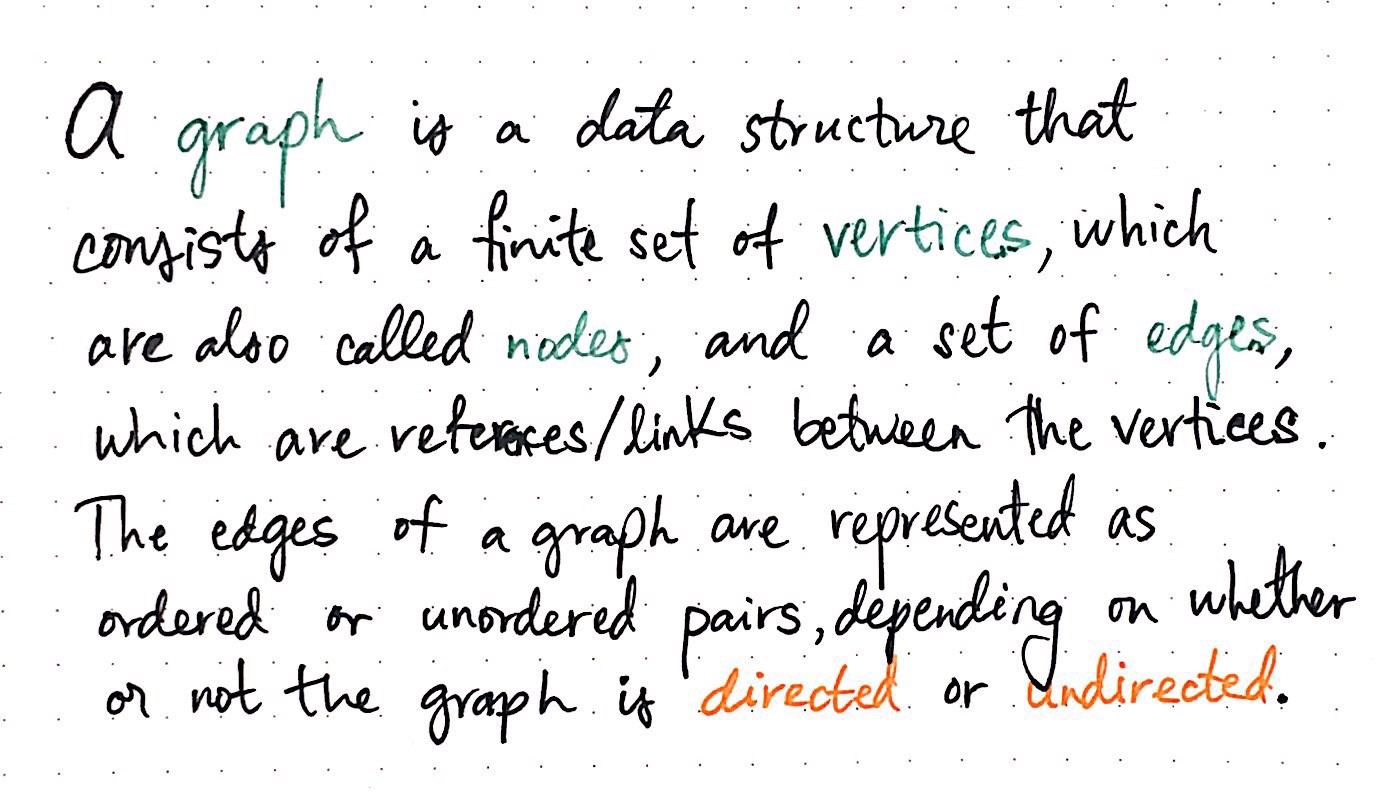
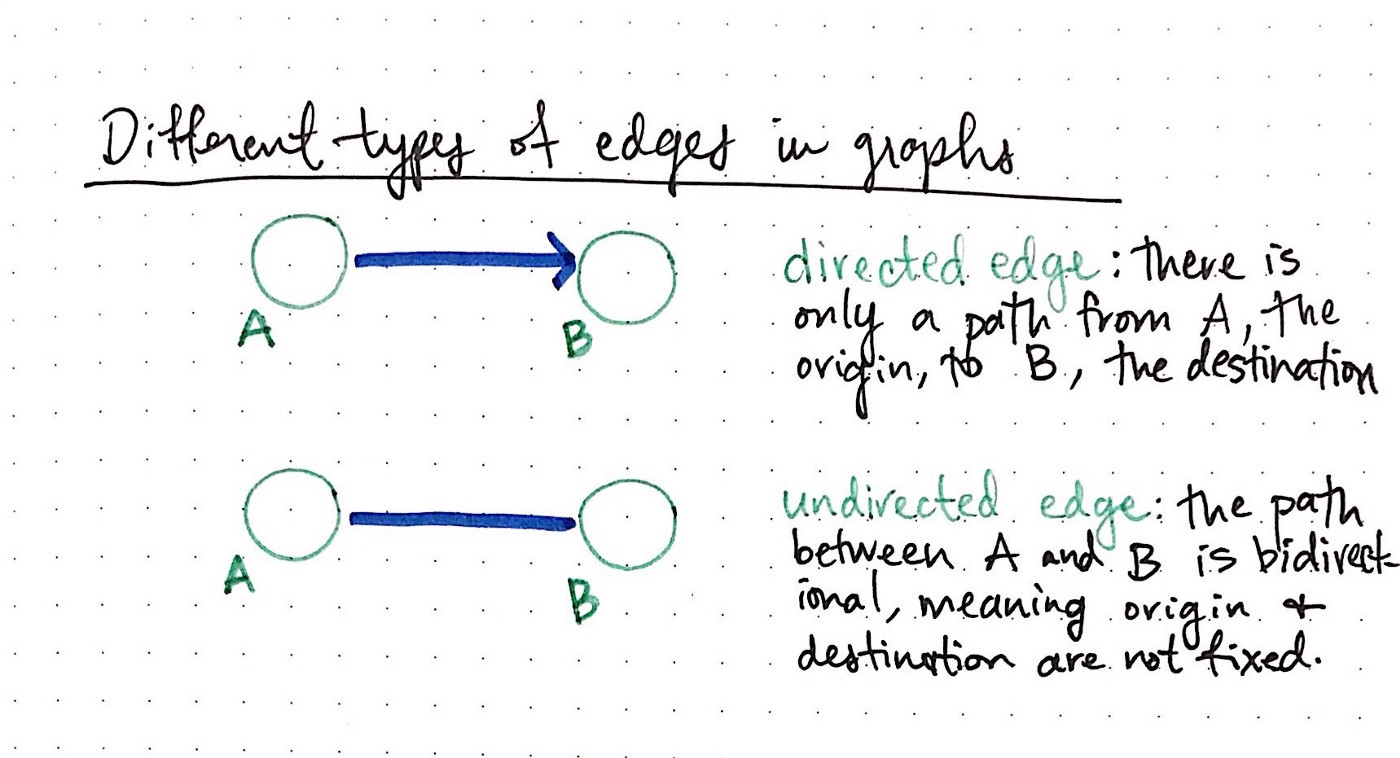
Edge Types
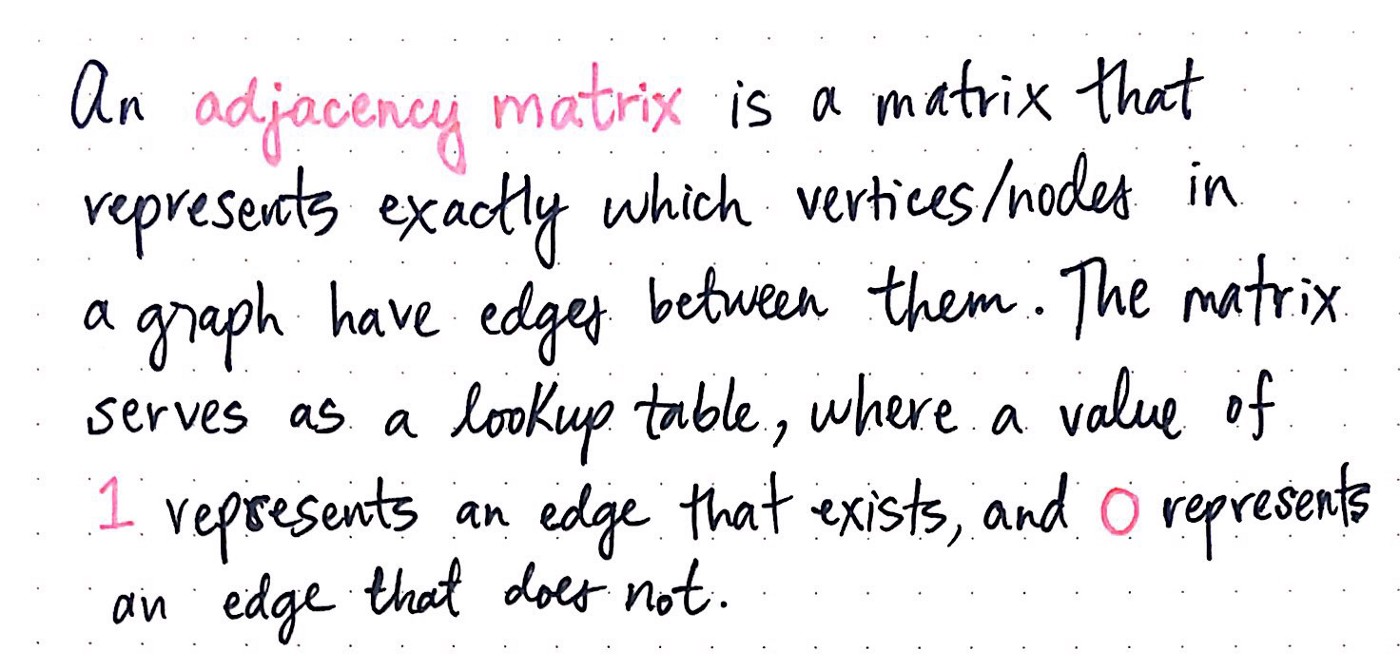
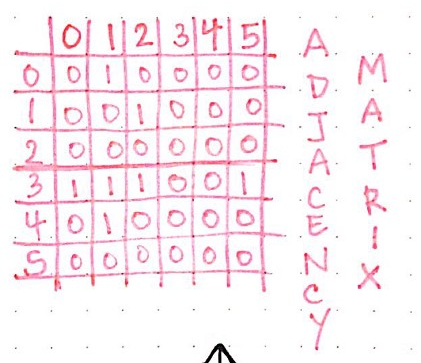
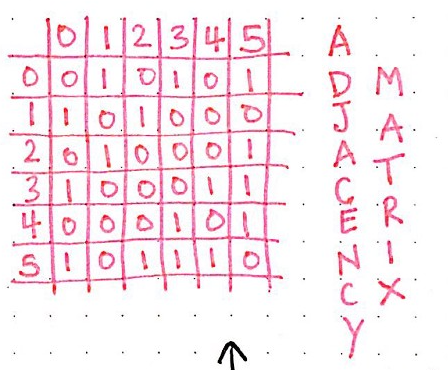
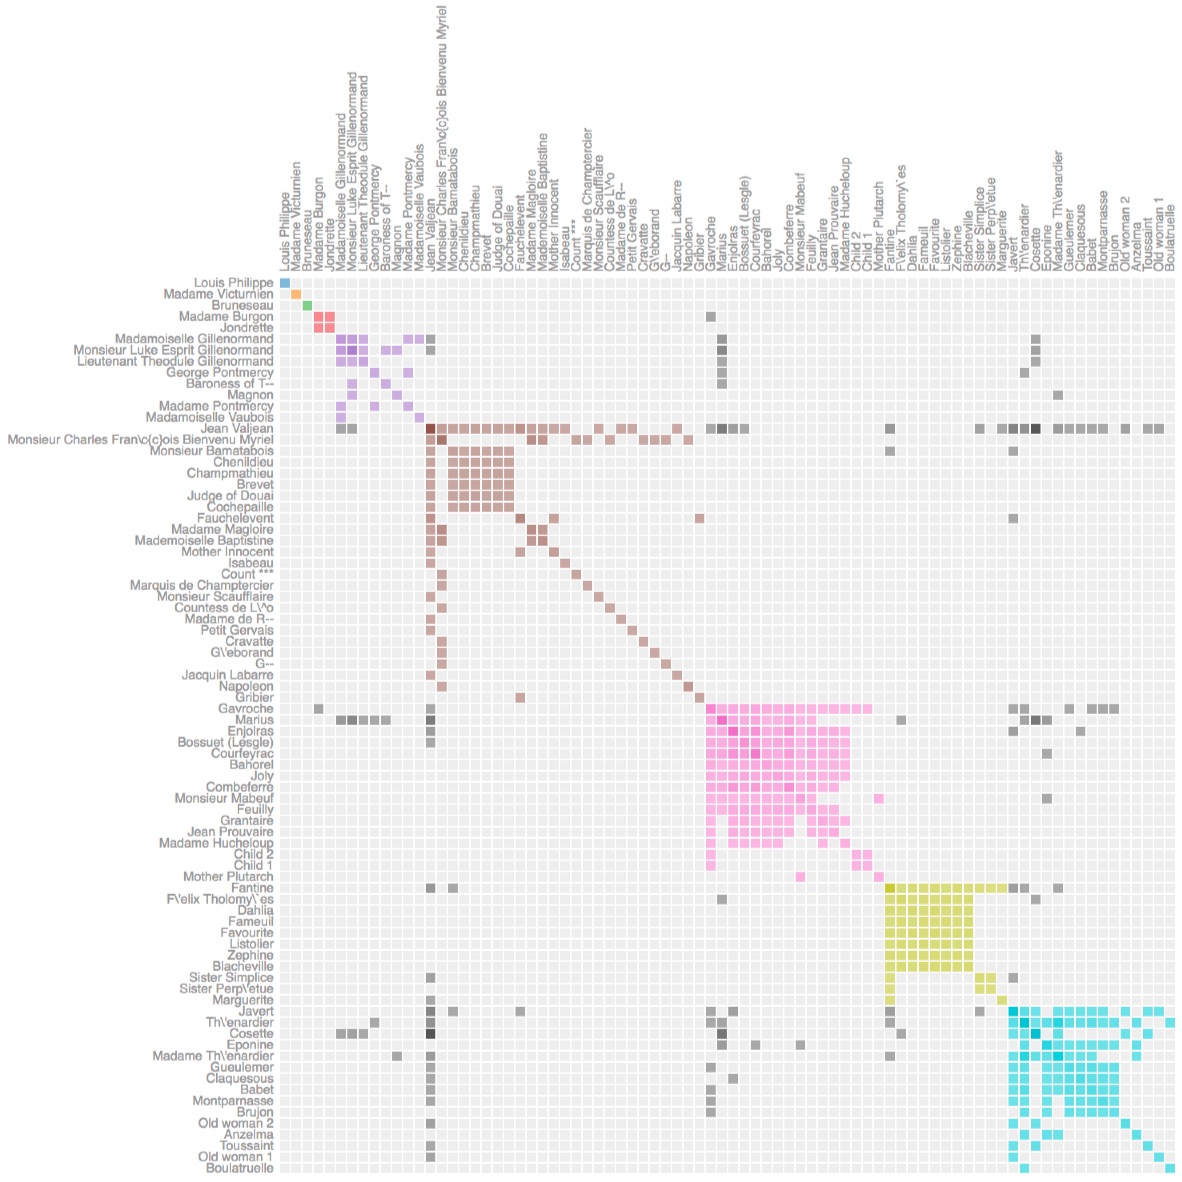
Adjacency Matrix
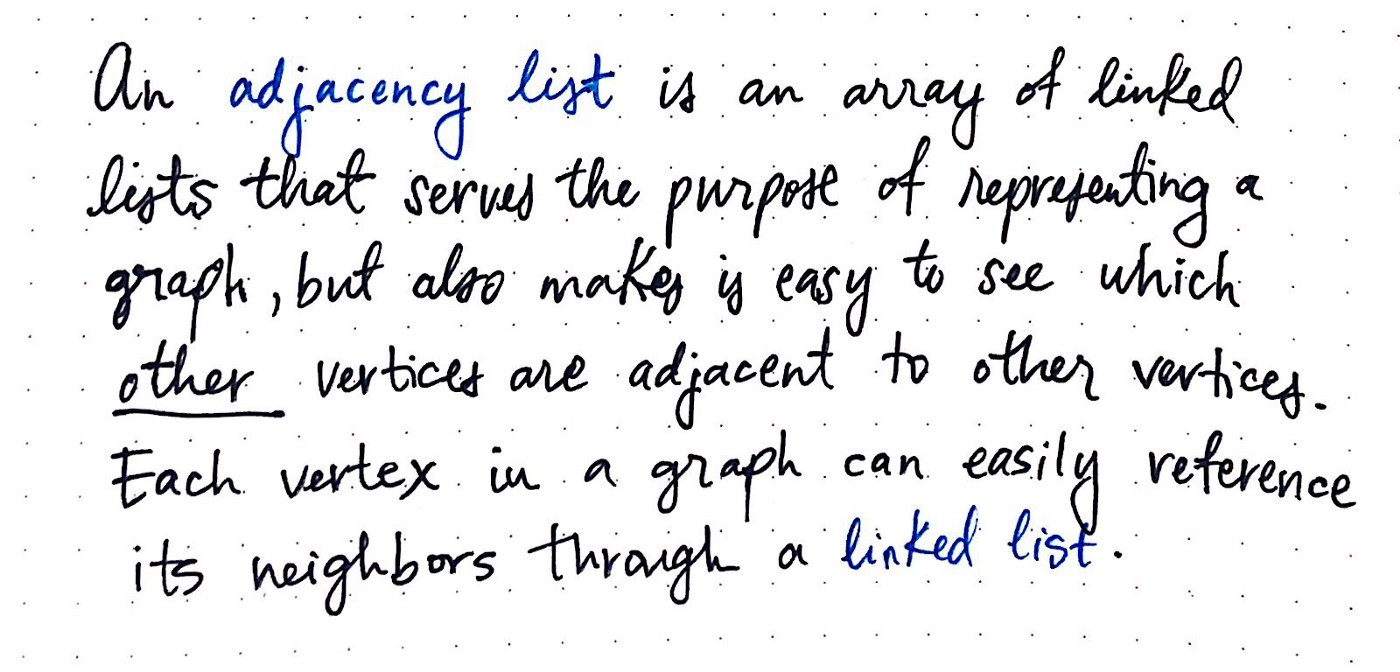
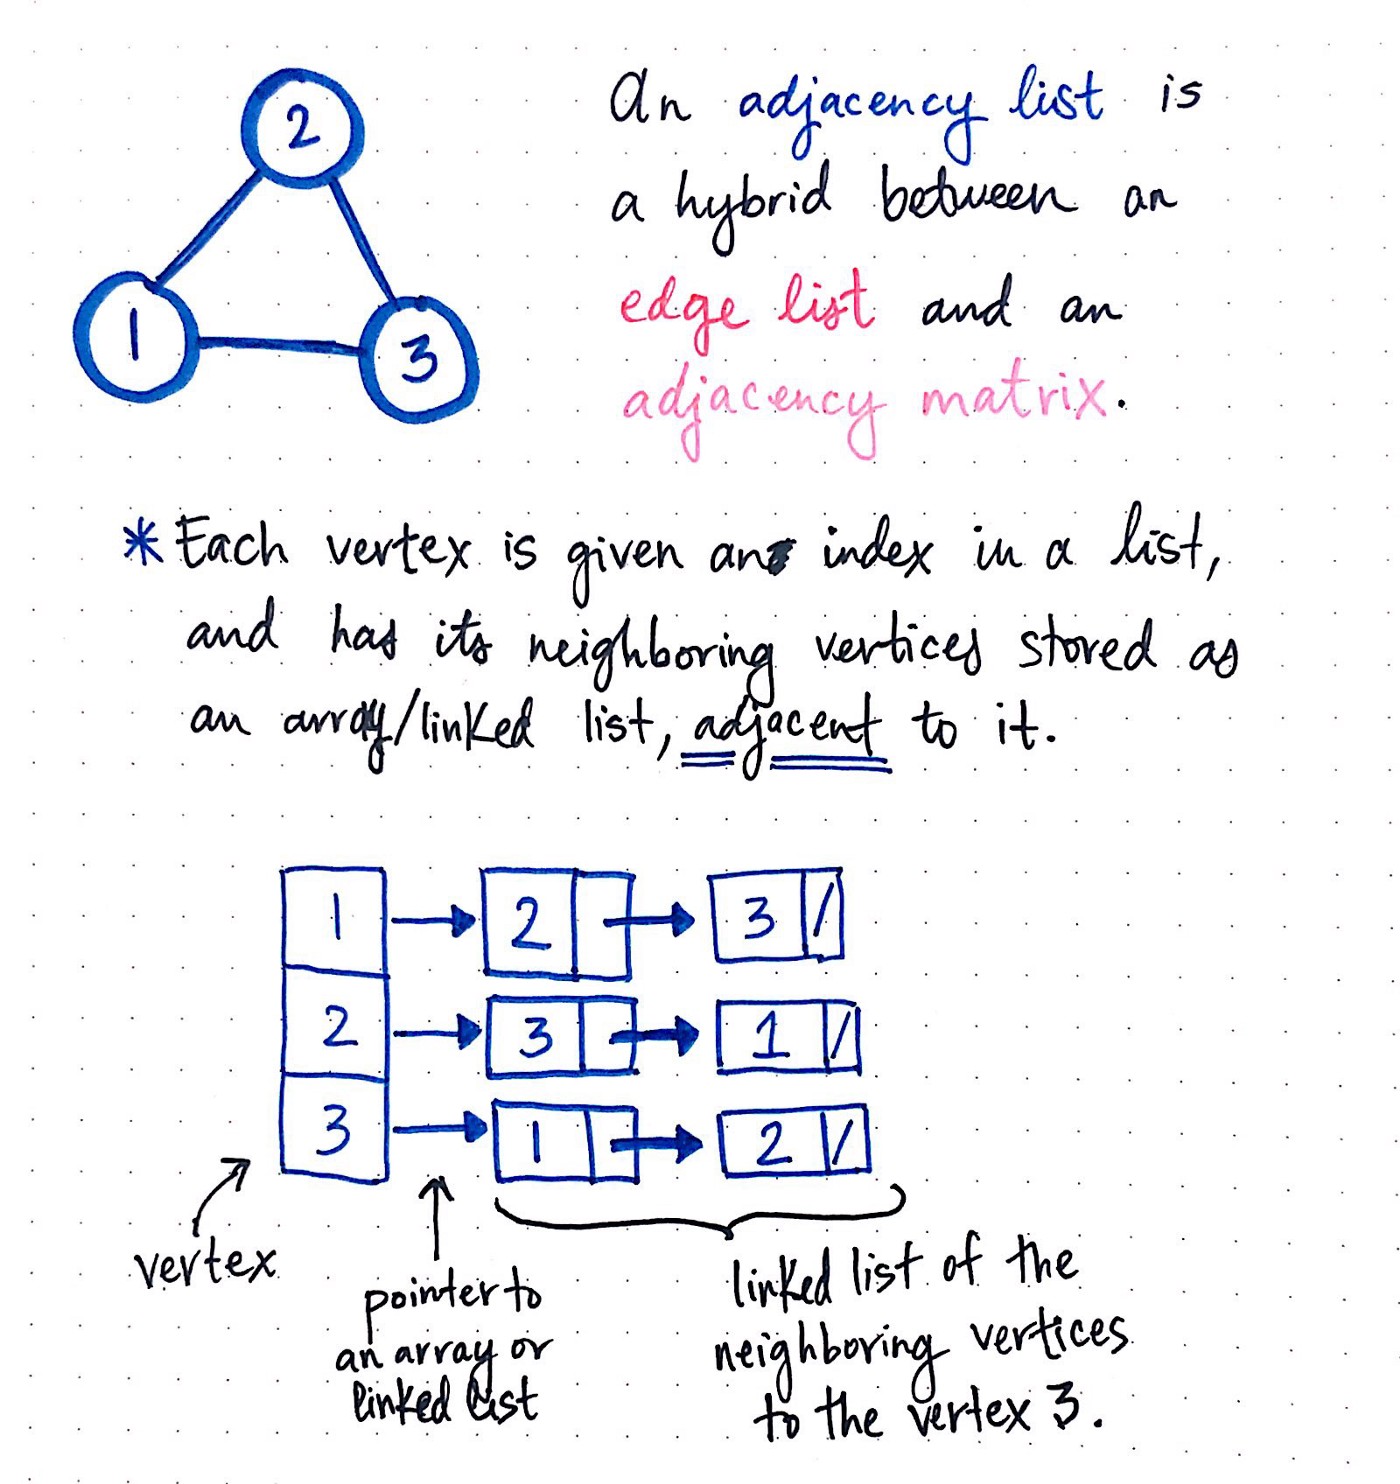
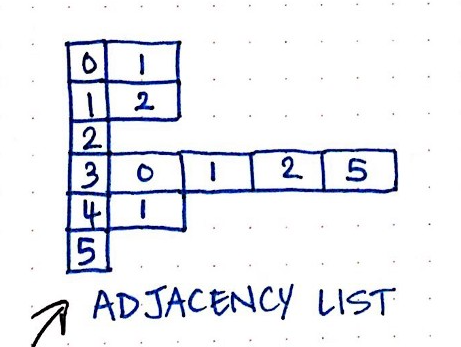
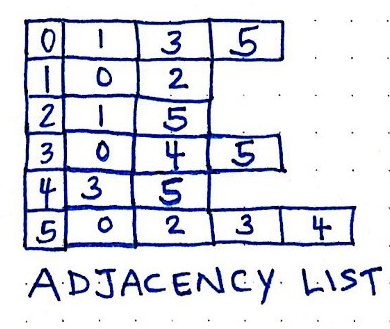
Adjacency List
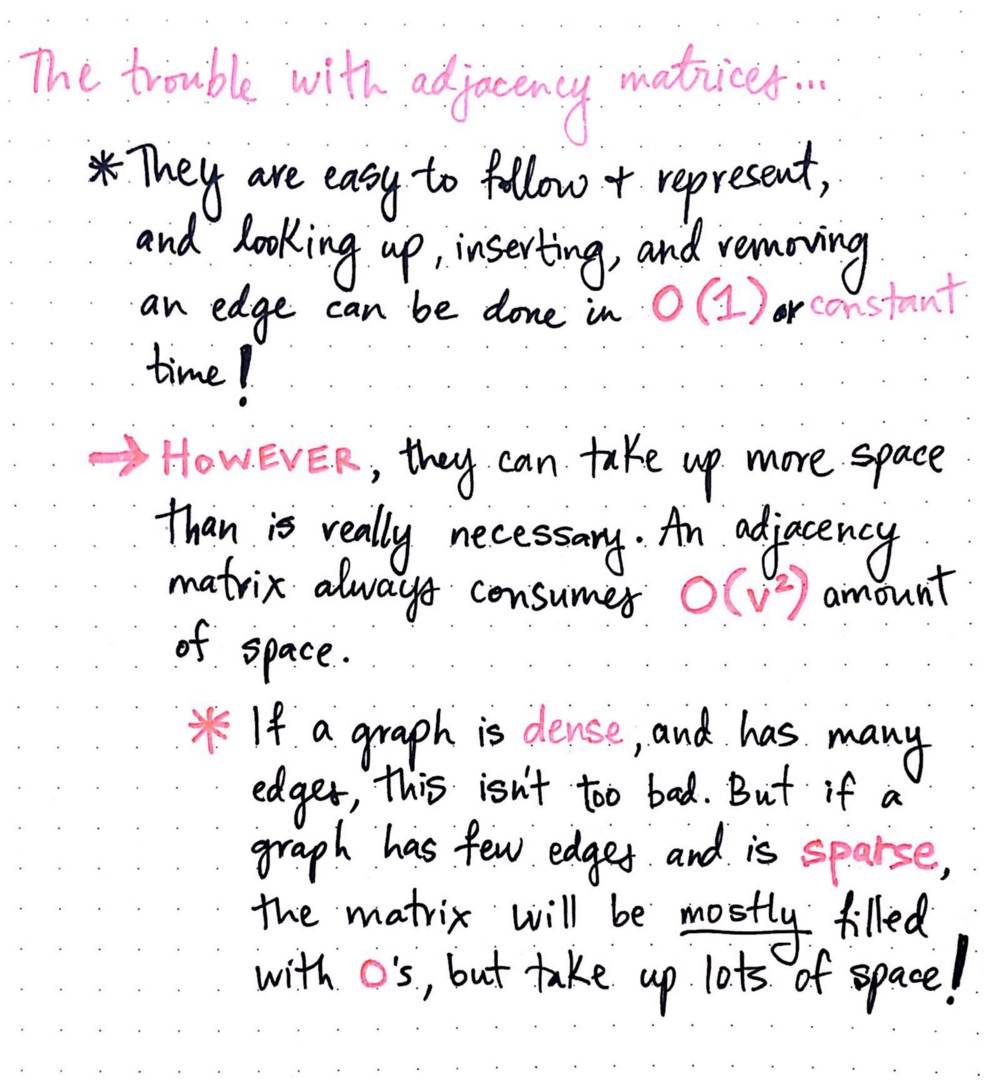
Caution!
Directed Edge List
Directed Adjacency Matrix
Directed Adjacency List
Undirected Edge List
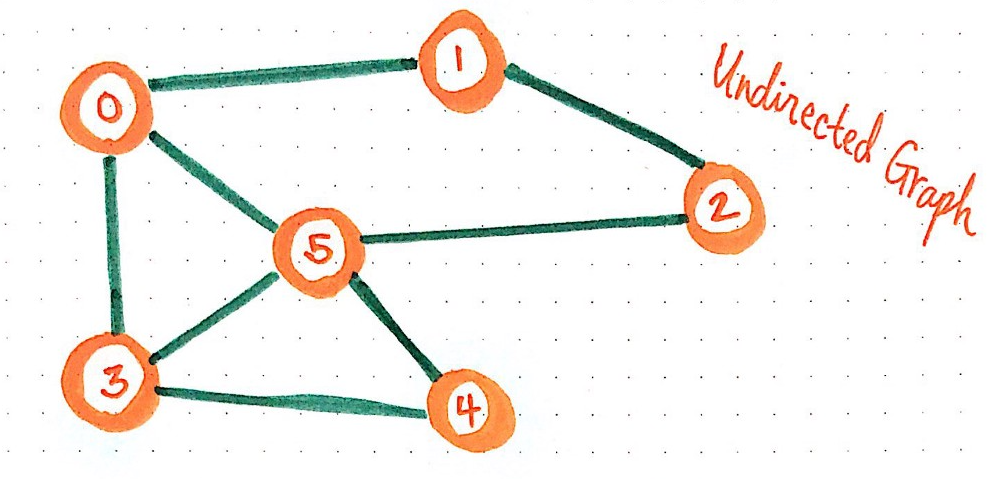
Undirected Adjacency Matrix
Undirected Adjacency List
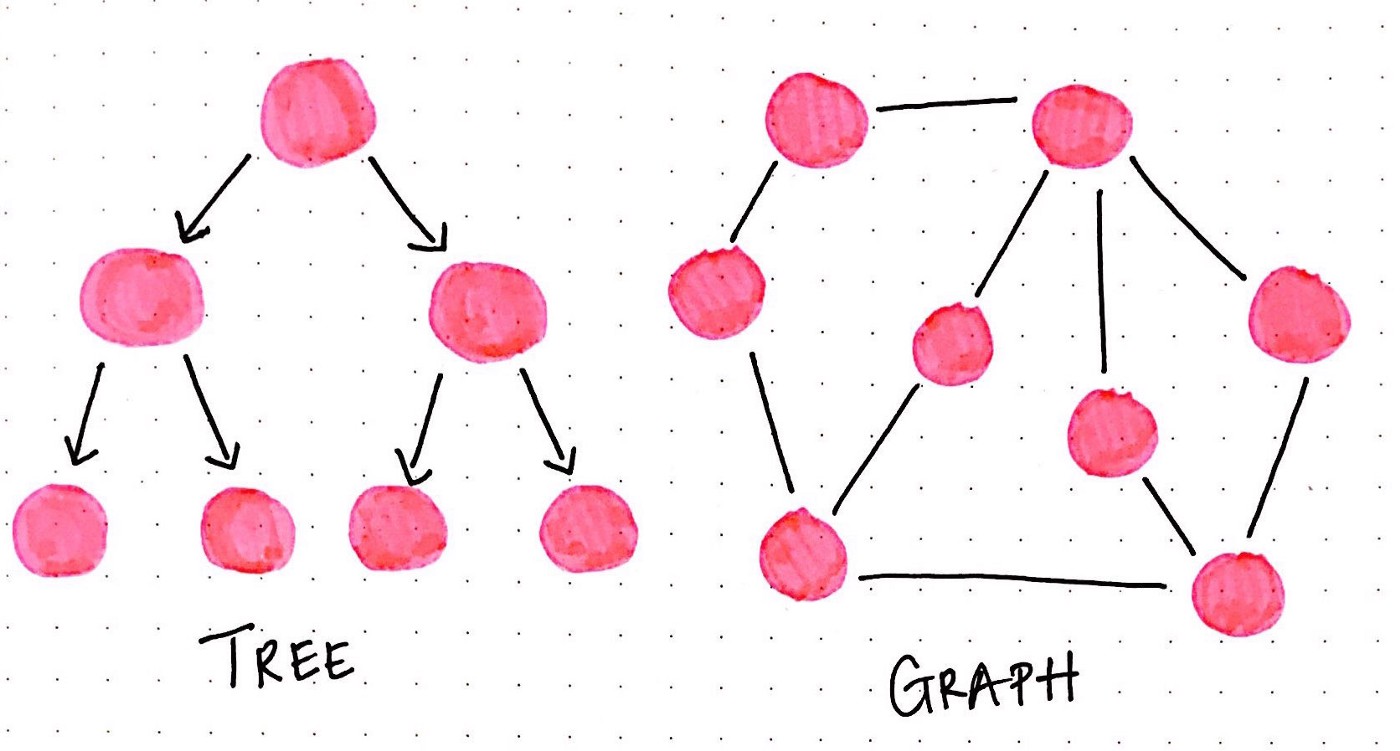
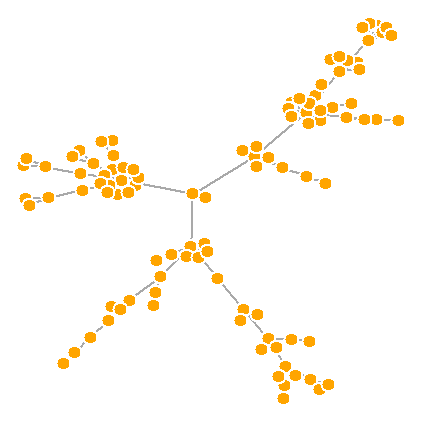
Trees vs. Graphs
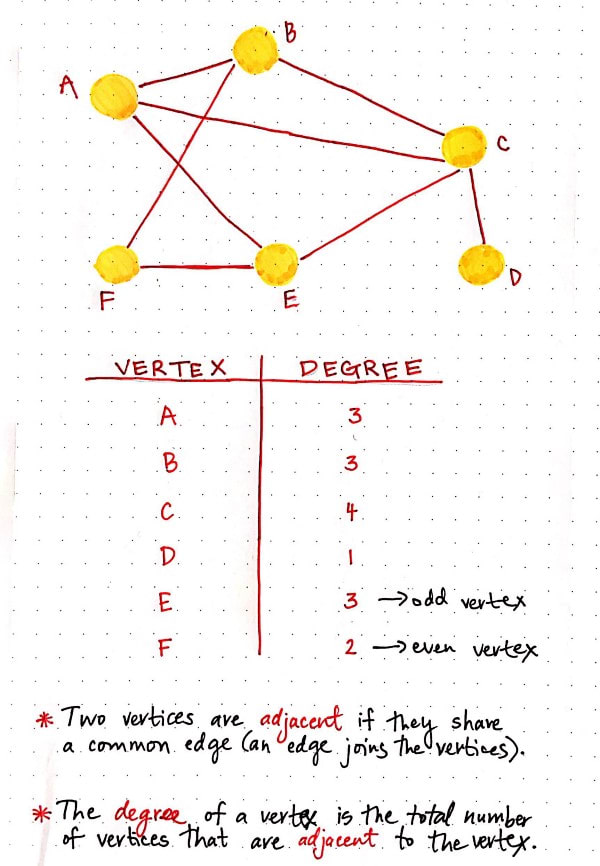
Node measurements
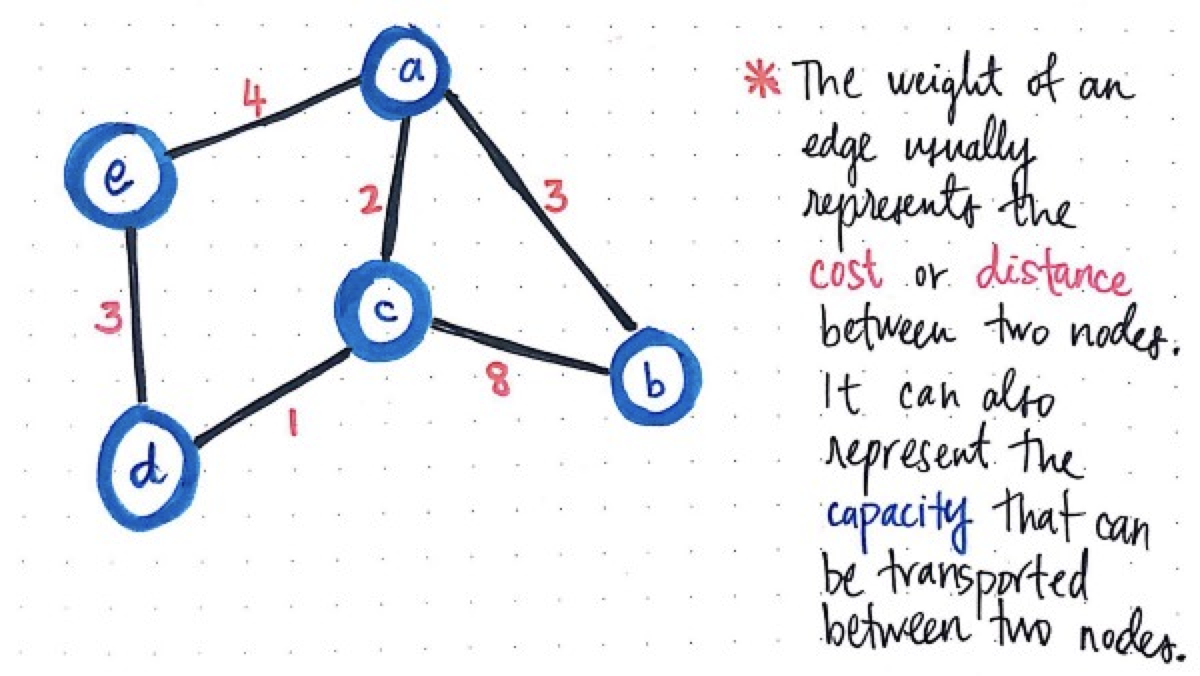
Edge weigths
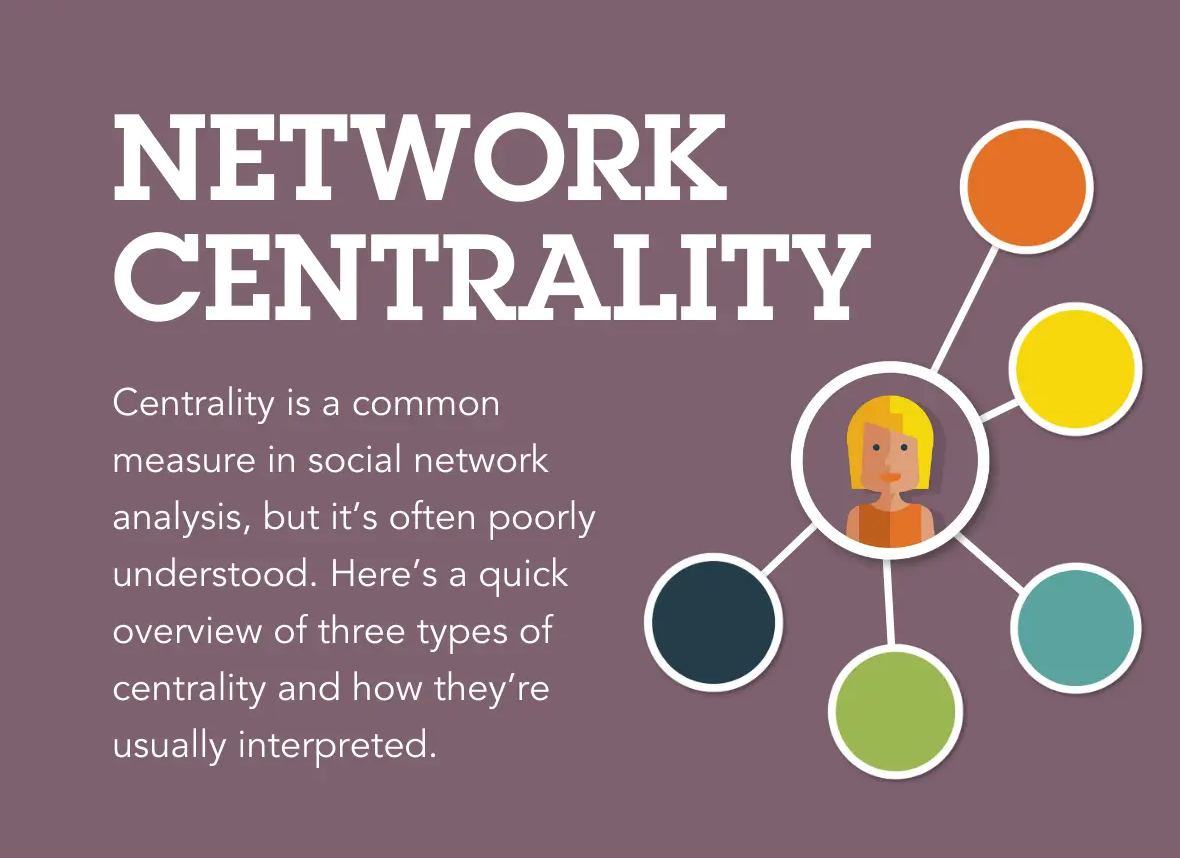
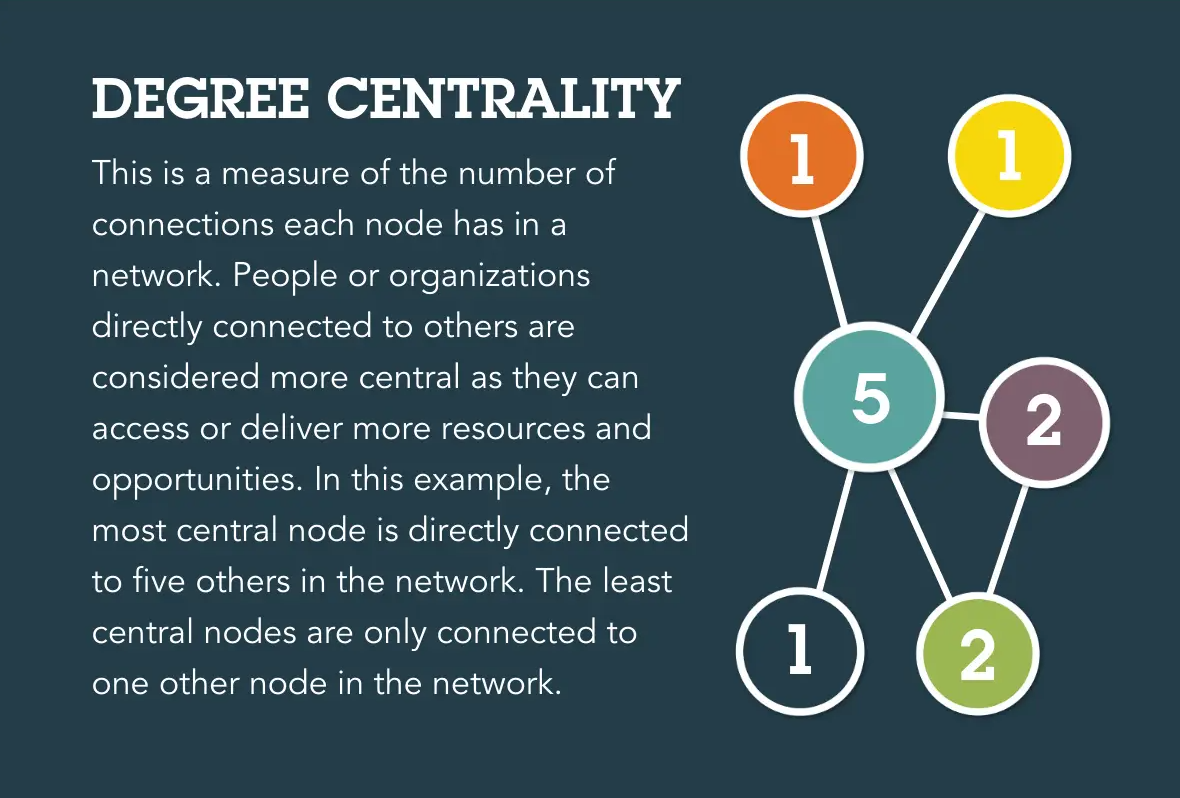
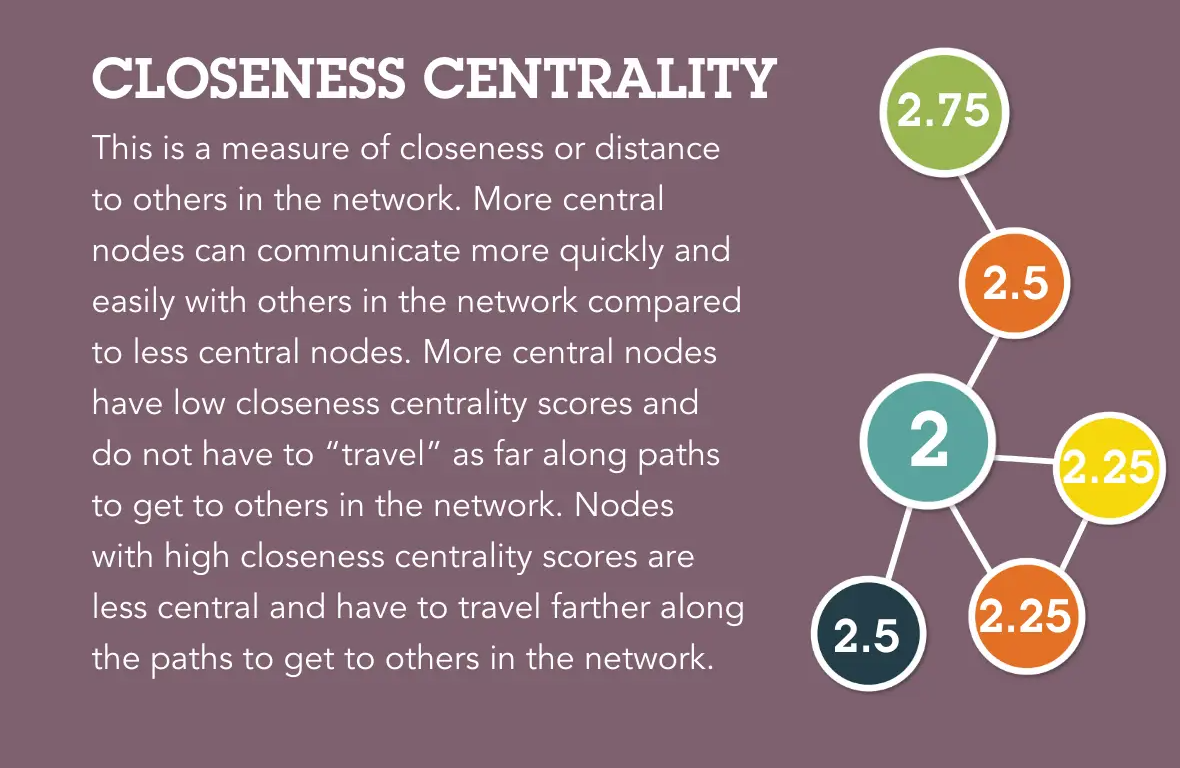
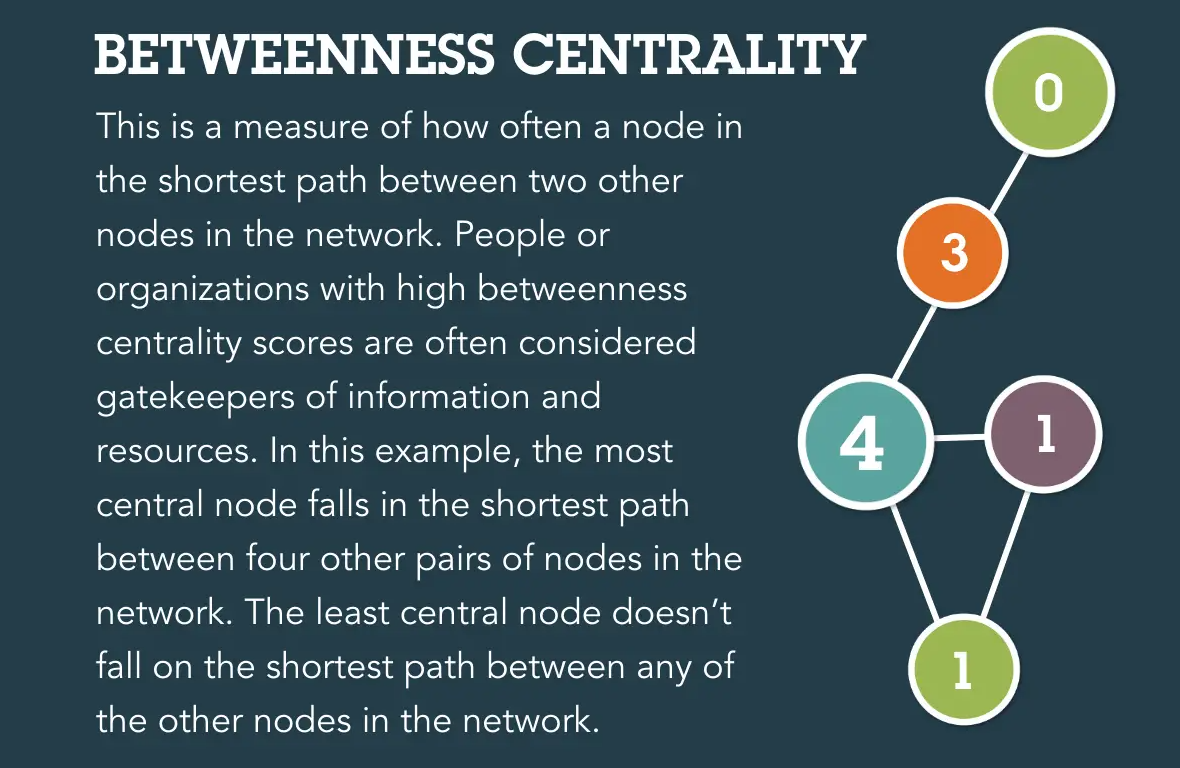
Various centrality measures
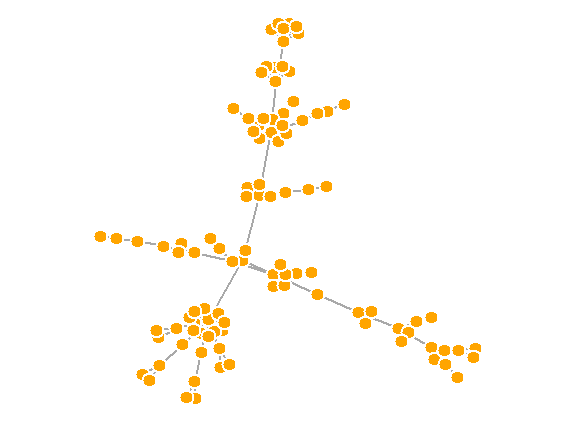
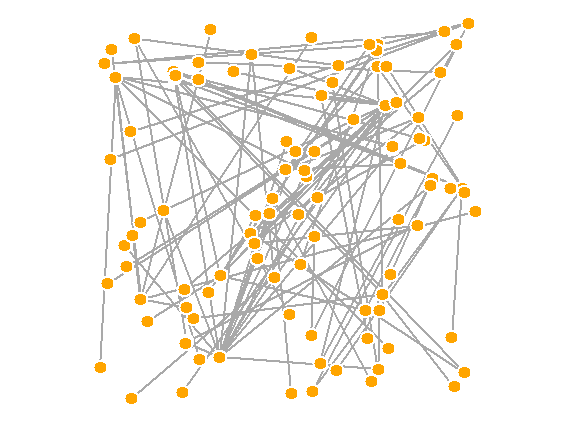
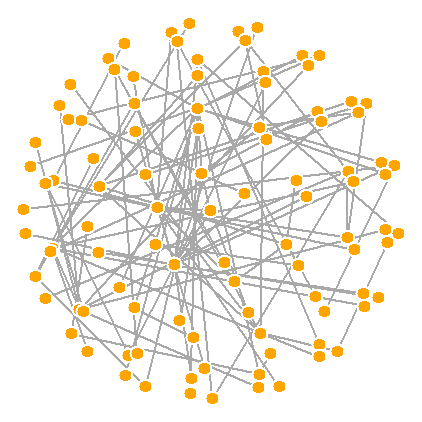
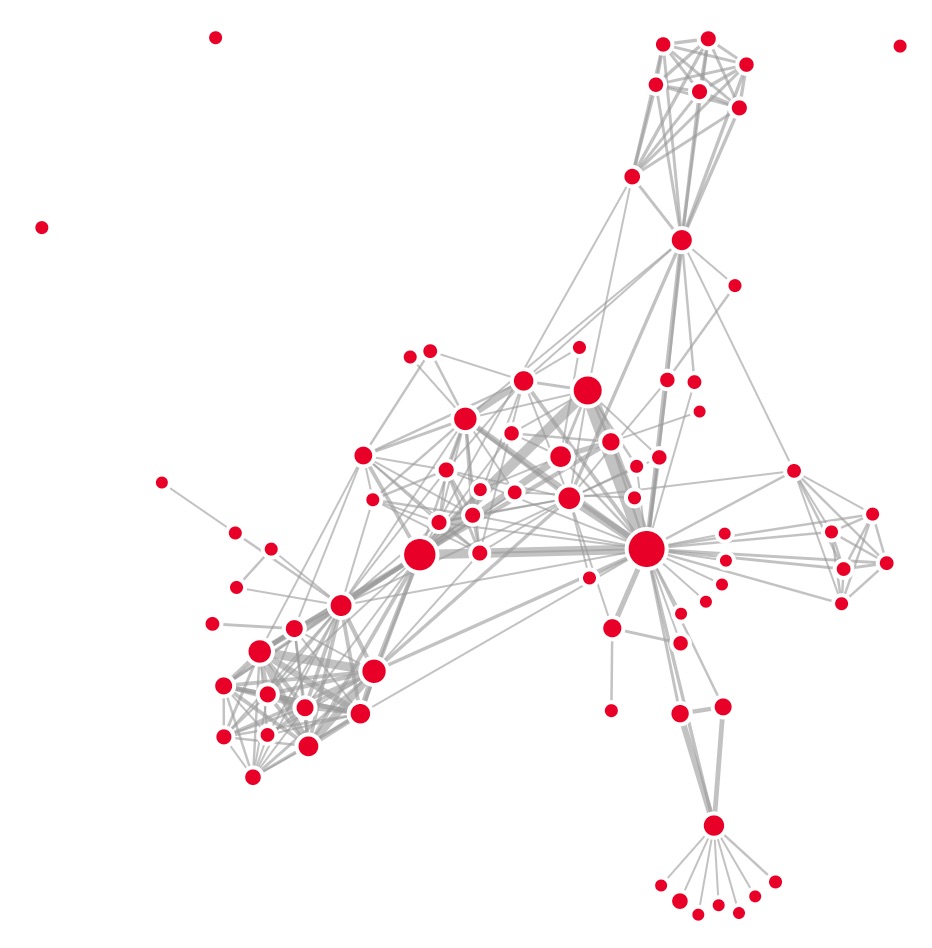
There are many positioning algorithms
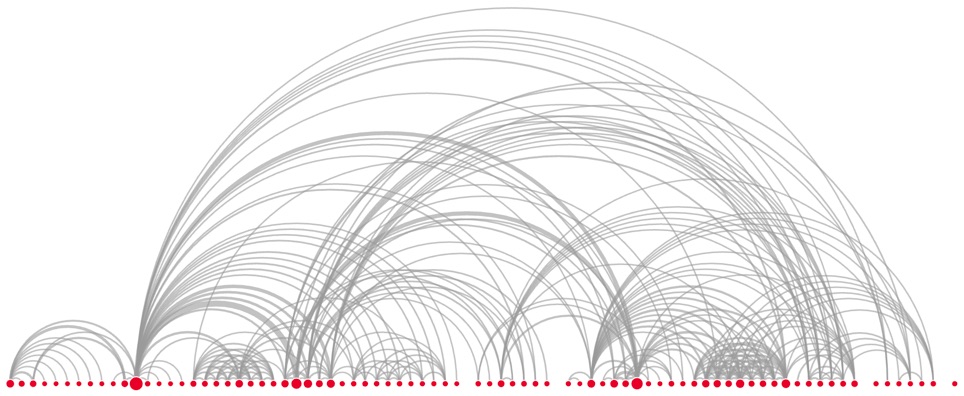
Arc Diagram
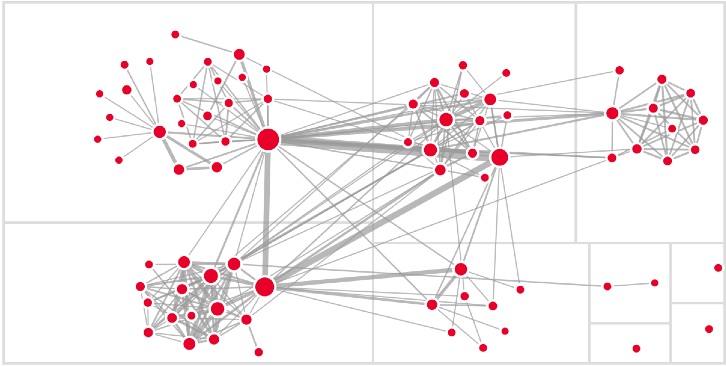
Grouped Clusters
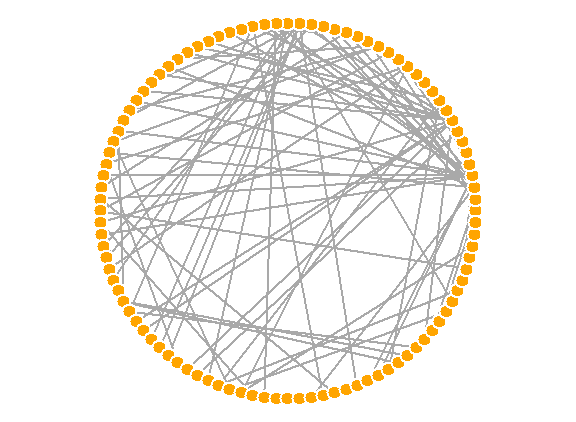
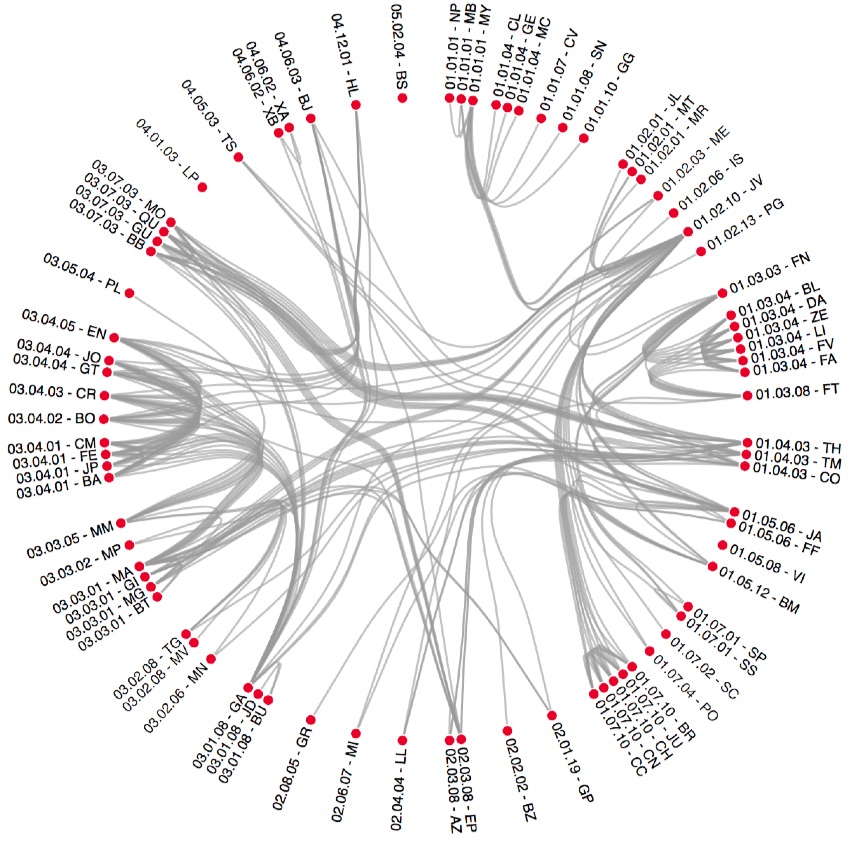
Chord or Radial
Visual Matrix (representing adjacency matrix)
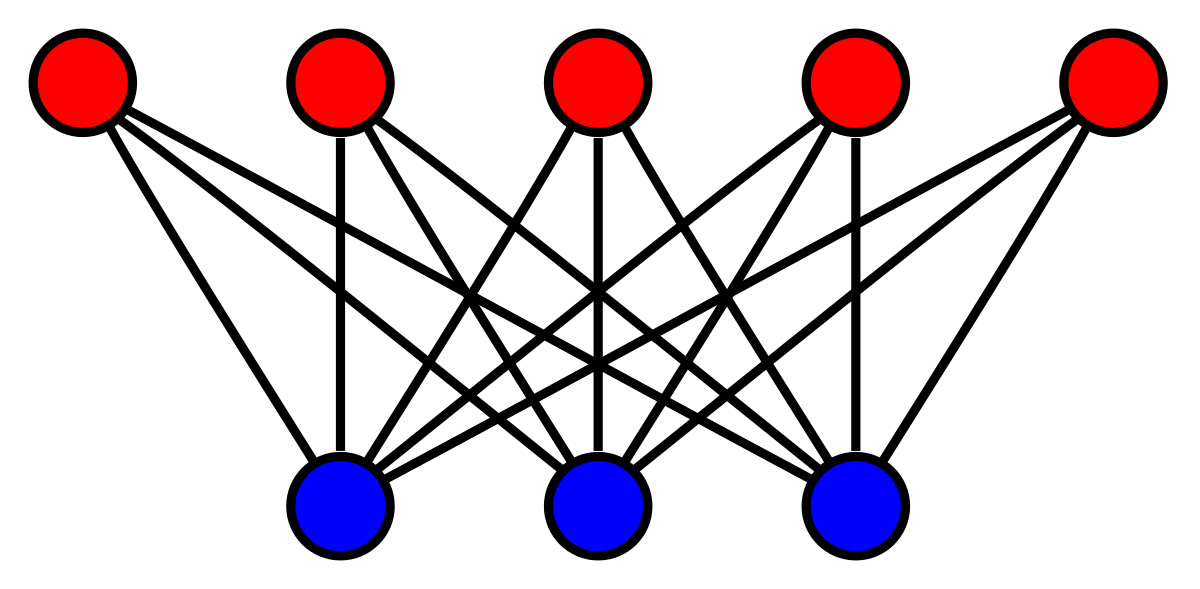
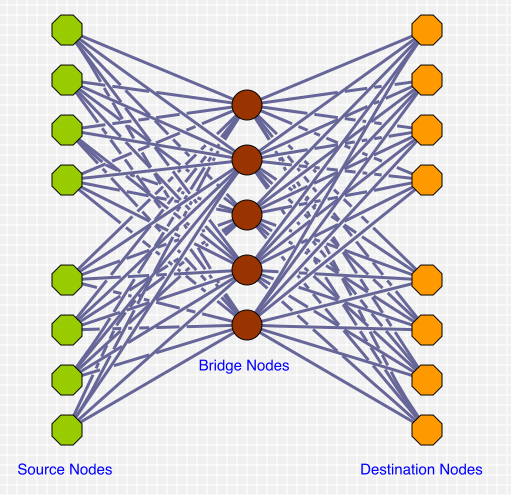
Multimodal graphs