Lecture 1
Course intro, expectations, why we visualize, gallery of bad visualizations, designing for an audience, visualization best-practices
Marck Vaisman
- AI & ML Cloud Architect and Data Scientist at Microsoft
- Teaching at Georgetown since 2016 & GWU since 2015
- Co-Founder of DataCommunityDC
- R Fanatic
Fun Facts
- I love music and try to play music at the beginning of class, typically EDM. Other genres I love are Latin, Bluegrass and Chill
- I speak fluent Spanish, I grew up in Venezuela
- Love beer & bourbon
- Goofball
- Westie owner
- I can speak like Donald Duck

Anderson Monken
- Data Science Manager at Federal Reserve Board of Governors
- Team uses big data, web development, software development, machine learning, and AI
- Technology and cloud initiatives
- Research focus in international trade and economics
- Adjunct Professor since 2022
- DSAN Program Graduate
Fun Facts
- Amateur car mechanic on several old BMWs
- Can solve a Rubik’s Cube in under a minute
- Canoe’d over 200 miles in Canada

Abhijit Dasgupta
- Data Science Associate Director at AstraZeneca supporting Oncology R&D
- bioinformatics, biomarkers, clinical studies
- autoencoders, survival analysis, signal processing
- Adjunct Professor at Georgetown since 2020
- R and reproducible research evangelist
- Python is cool too!!
- Co-founder of Statistical Programming DC (with Marck Vaisman)
Fun Facts
- I’m a 4th degree black belt in Aikido,
- over 30 years experience providing flyer miles
- Exploring global whiskey, currently on Japan
- Active in community theater, mainly behind but sometimes on-stage.

Jeff Jacobs
- Assistant Teaching Professor since 2023
- Finished up PhD in Political Economy from Columbia University in NYC in 2022
- Research papers: NLP for empirical studies of labor economics, game theory for normative models of justice/domination/exploitation in labor markets
- Dissertation: Using NLP to study history of political thought as a series of rhetorical “wars of words”, from 18th century to present
Fun Facts
- Born and raised ~5 minutes east of Georgetown campus!
- Passion project: Teaching CS + Design Thinking classes each summer in refugee camps in Gaza, the West Bank, and one time in northern Syria
- Favorite hobbies: Making moody computer music, reading books that I don’t have to read to procrastinate reading books that I do have to read
- Lover of all animals but especially my cat Biko


It ain’t that easy

Data visualization is neither simple nor easy. It requires thought, creativity and understanding both the data and the topic/aspect/answer you are trying to express through the visualization. Give yourself ample time to think, explore and experiment. It is very easy for us to determine when you didn’t give yourself enough time and “phoned it in”.
- Starting out is easy, especially with the current software tools.
- However, getting to presentation/publication quality takes a lot of effort and/or tweaking
Let’s avoid this

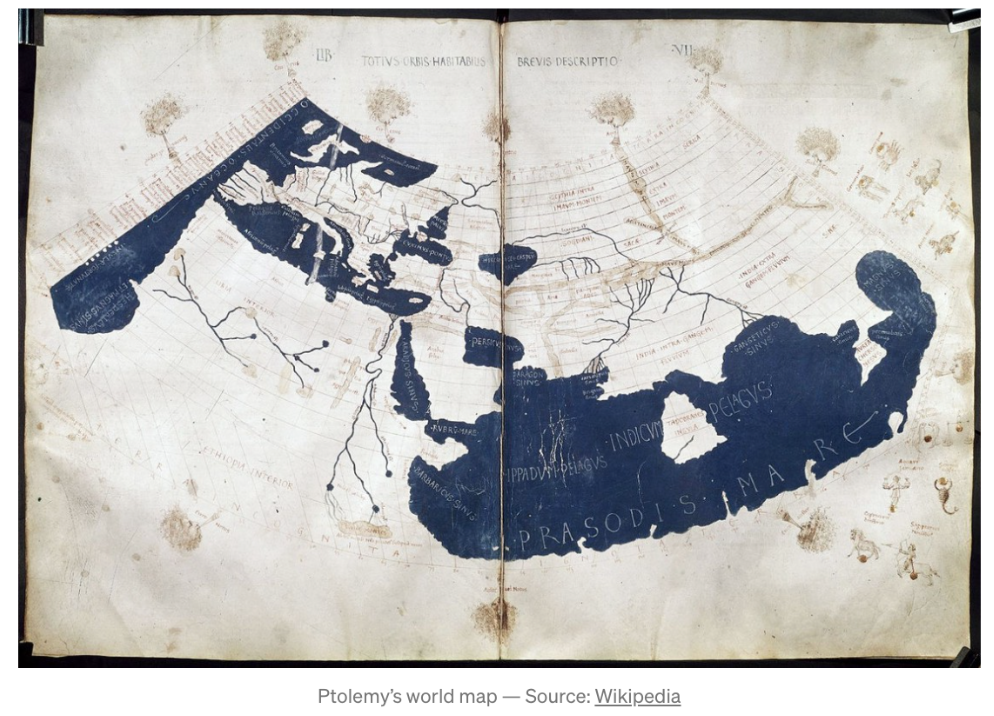
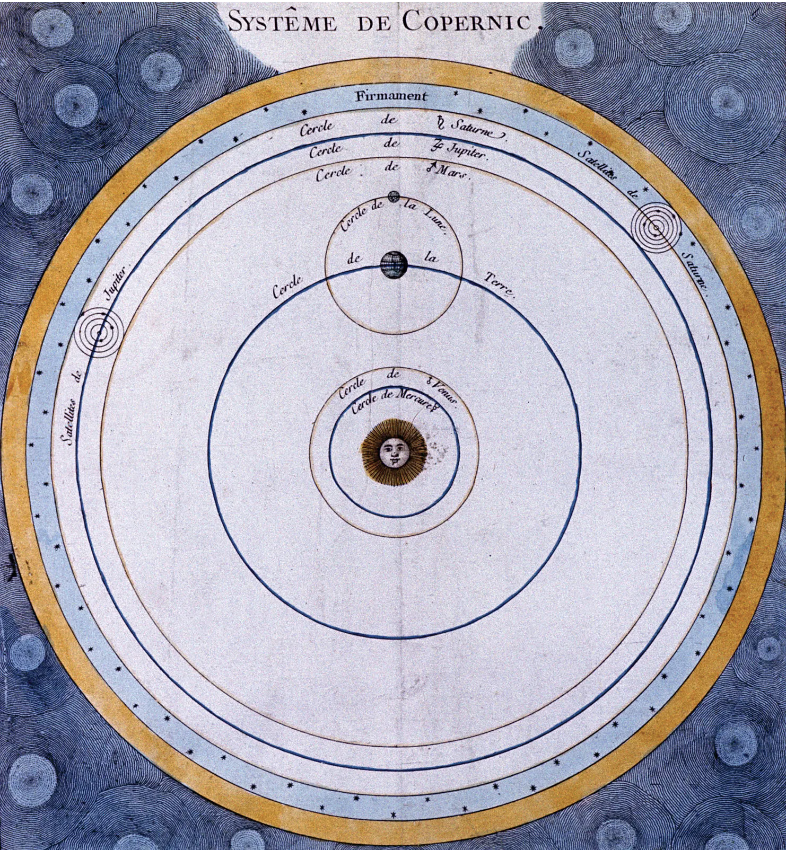
Where did it start?
- The original “data visualizers” were map makers, astronomers and navigators

The scientific revolution
The industrial revolution
1854: John Snow cholera clusters in London

- Geospatial mapping of homes with cholera cases
- One of the first cases of spatial epidemiology
- Visually identified clusters of incident cases around a particular water source
Industrial revolution
1856: Florence Nightingale: Causes of mortality in the Army in the East
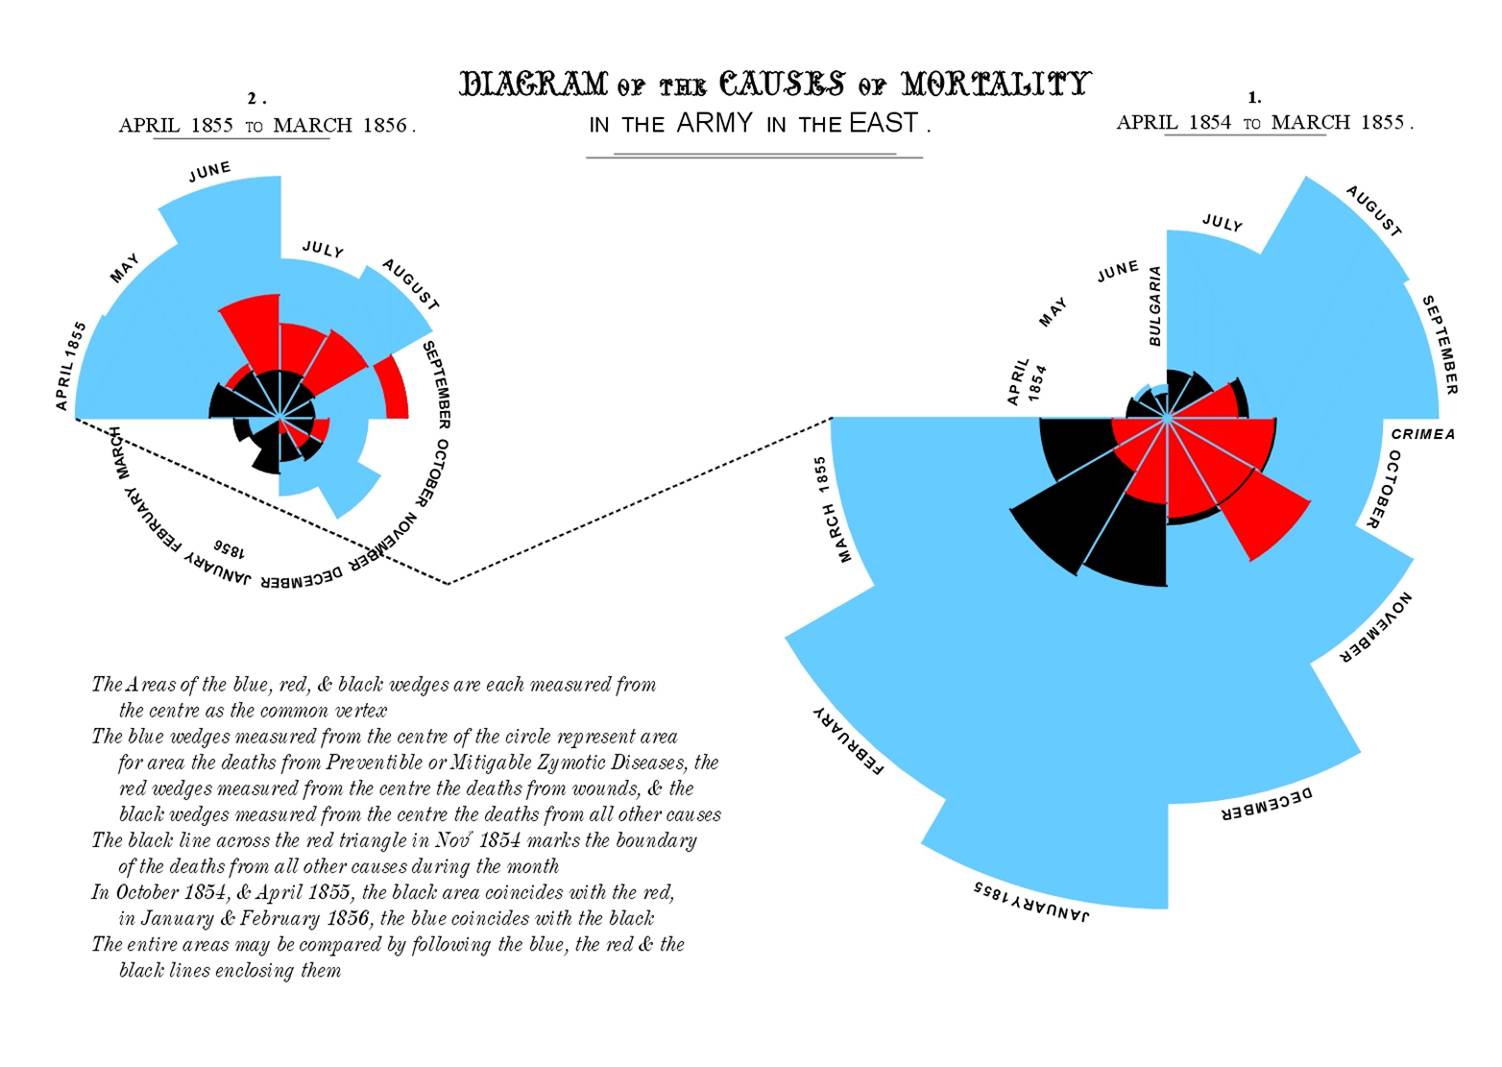
Convince generals that most deaths were preventable and not directly from war wounds
War time
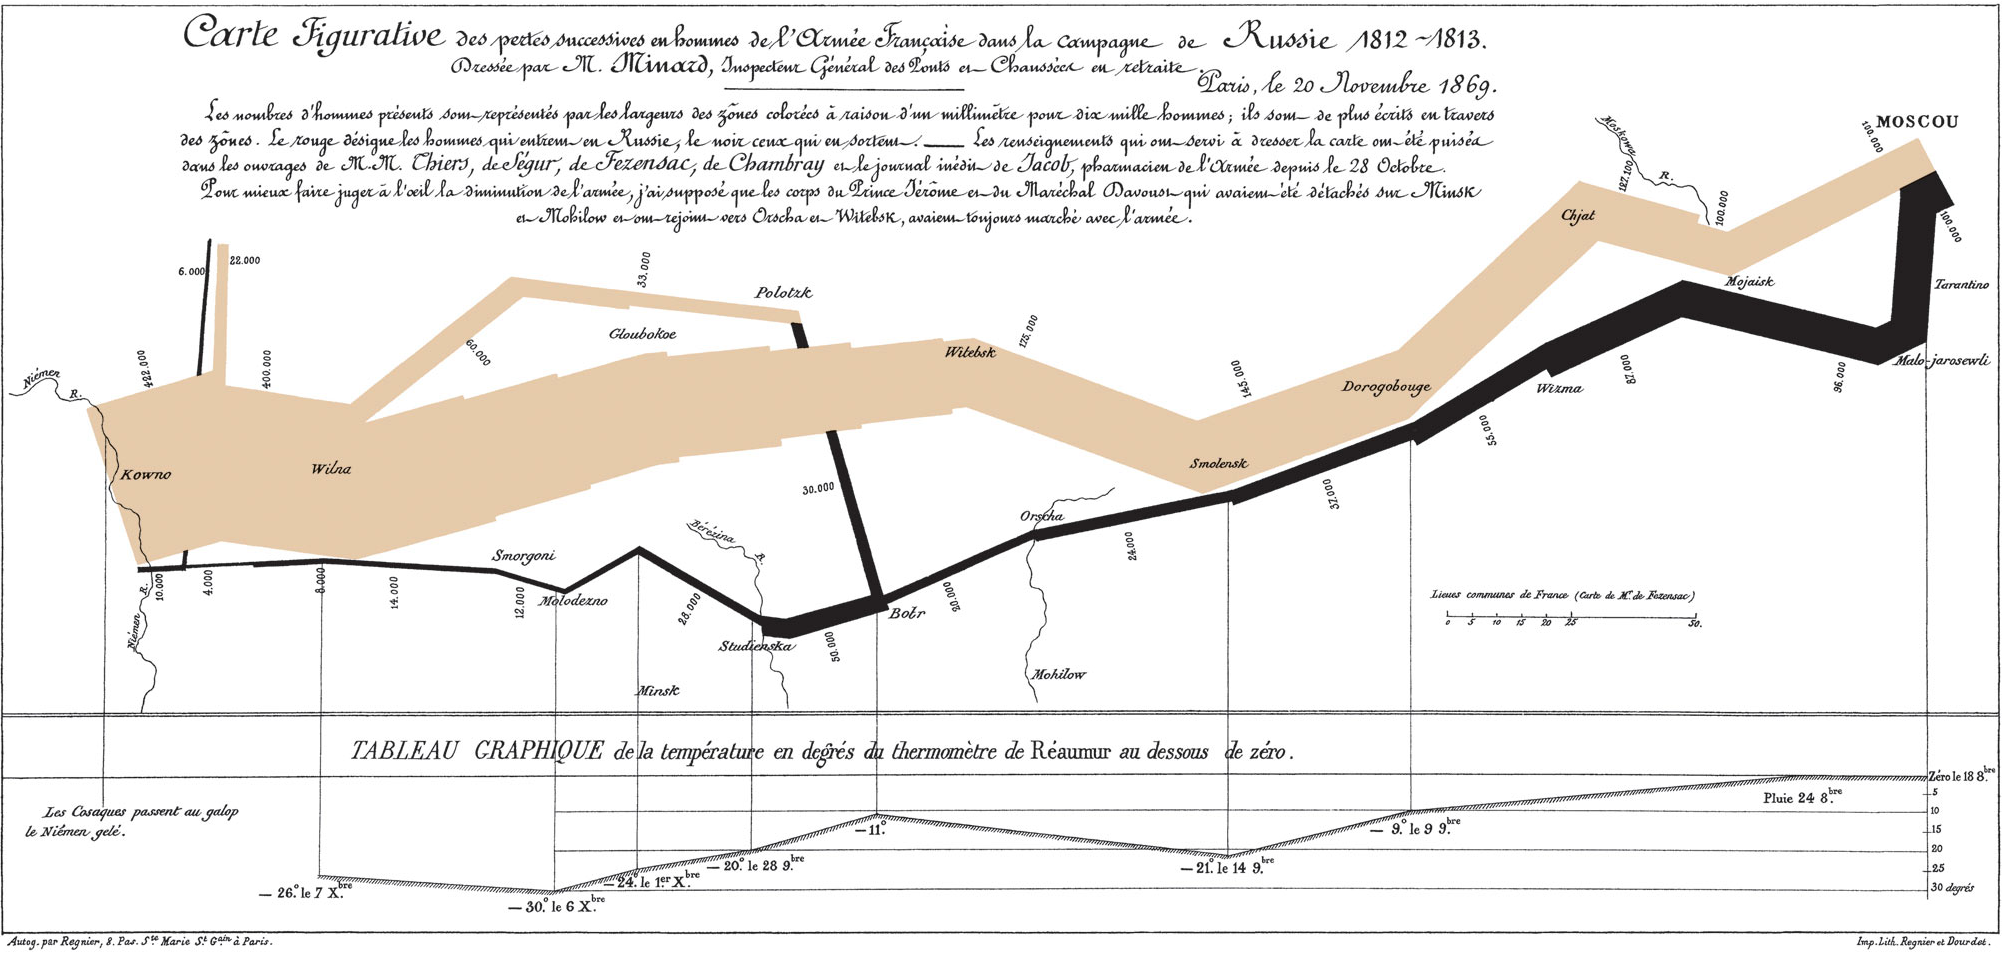
1869: Minard: Flow of Napoleon’s army during his war with Russia
Why is data visualization important?
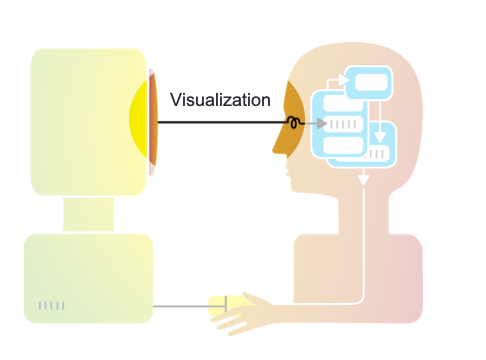
Humans are visual learners
Most people are inherently visual
We have a highly developed visual cortex
Visualizations take advantage of our innate capability to understand visual patterns quickly and intuitively
Visualizations also take advantage of our ability to detect weird patterns or aberrations

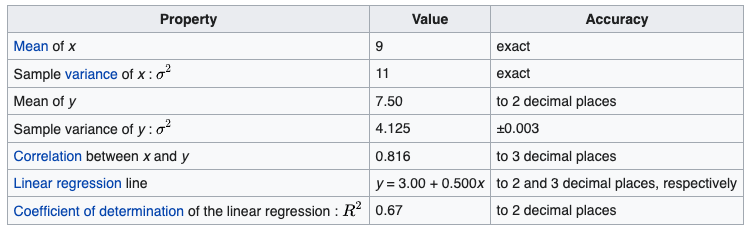
Summaries don’t differentiate
- Anscombe (1973) created these toy examples
- Averages of x and y are the same
- Correlation between x and y are the same
- Relationships are VERY different
![]()

A modern take: the datasaurus
Regardless of pattern, the points have the same marginal means and variances and the same Pearson correlation!!
Our choice of visualization determines what is revealed
Three varying 1D distributions of data, all with the same boxplot representation.
Note that as the data changes, both the histogram and strip plot reflects the changes, but the boxplot doesn’t
Our choice of visualization determines what is revealed
Seven distributions of data, shown as raw data points (of strip-plots), as box plots, and as violin plots
Last 3 figs: Matejka & Fitzmaurice (2017)
You see something similar here. The violin plot can show distributional changes while the boxplot can’t
Is this really a problem for using boxplots?
Not really. Most of the time we’re trying to show differences in location (mean,median) rather than differences in distribution. The boxplot does perfectly well showing those differences
Simpson’s paradox
Code
suppressPackageStartupMessages(library(tidyverse, quietly = T, warn.conflicts = F))
suppressPackageStartupMessages(library(MASS, quietly = T, warn.conflicts = F))
set.seed(5)
d <- list()
d[['Group 1']] <- as.data.frame(
  mvrnorm(n=1000, mu = c(0,0), Sigma=matrix(c(2,-0.7,-0.7,2), ncol=2))
)
d[['Group 2']] <- as.data.frame(
  mvrnorm(n = 1000, mu = c(3,3), Sigma = matrix(c(2,-0.7,-0.7,2), ncol=2))
)
d[['Group 3']] <- as.data.frame(
  mvrnorm(n=1000, mu = c(6,6), Sigma = matrix(c(2,-0.7, -0.7,2), ncol=2))
)
D <- bind_rows(d, .id = 'Group')

theme_set(theme_bw())
ggplot(D, aes(V1, V2)) + geom_point() + geom_smooth(method='lm', color ='red')
ggplot(D, aes(V1, V2)) + geom_point(aes(color = Group), show.label=F) +
  geom_smooth(aes(color = Group), se=F, method='lm')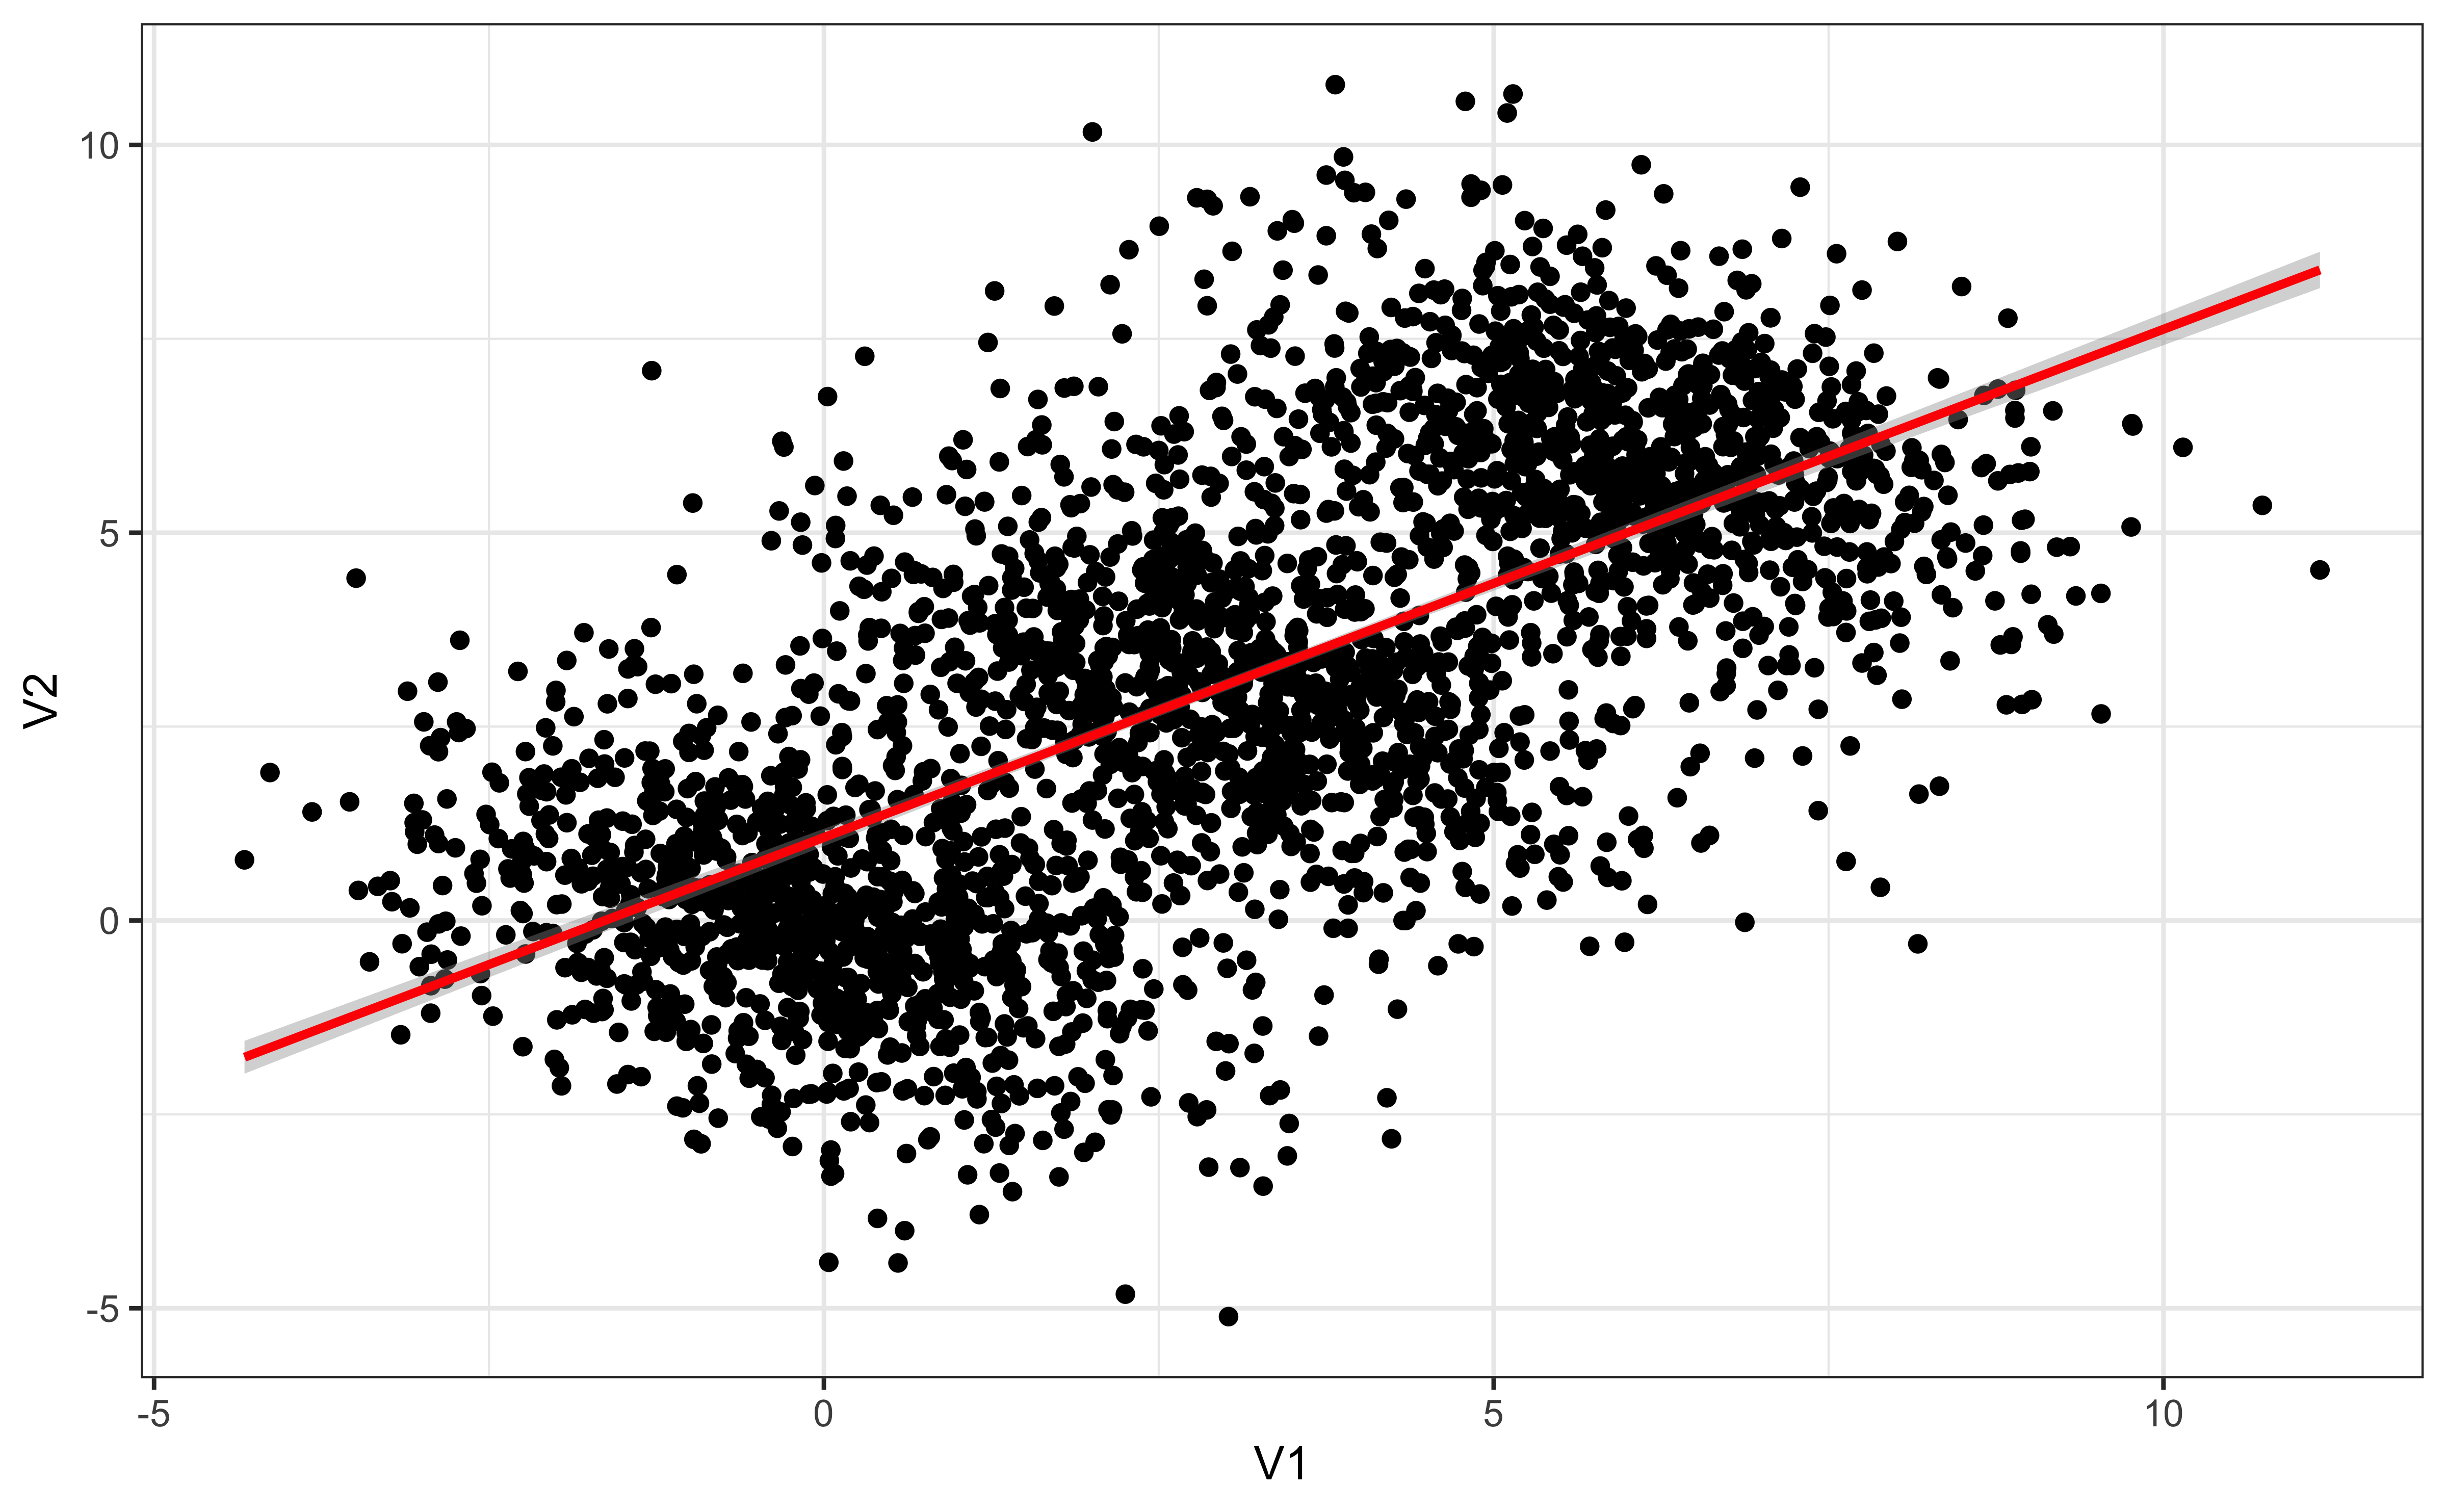
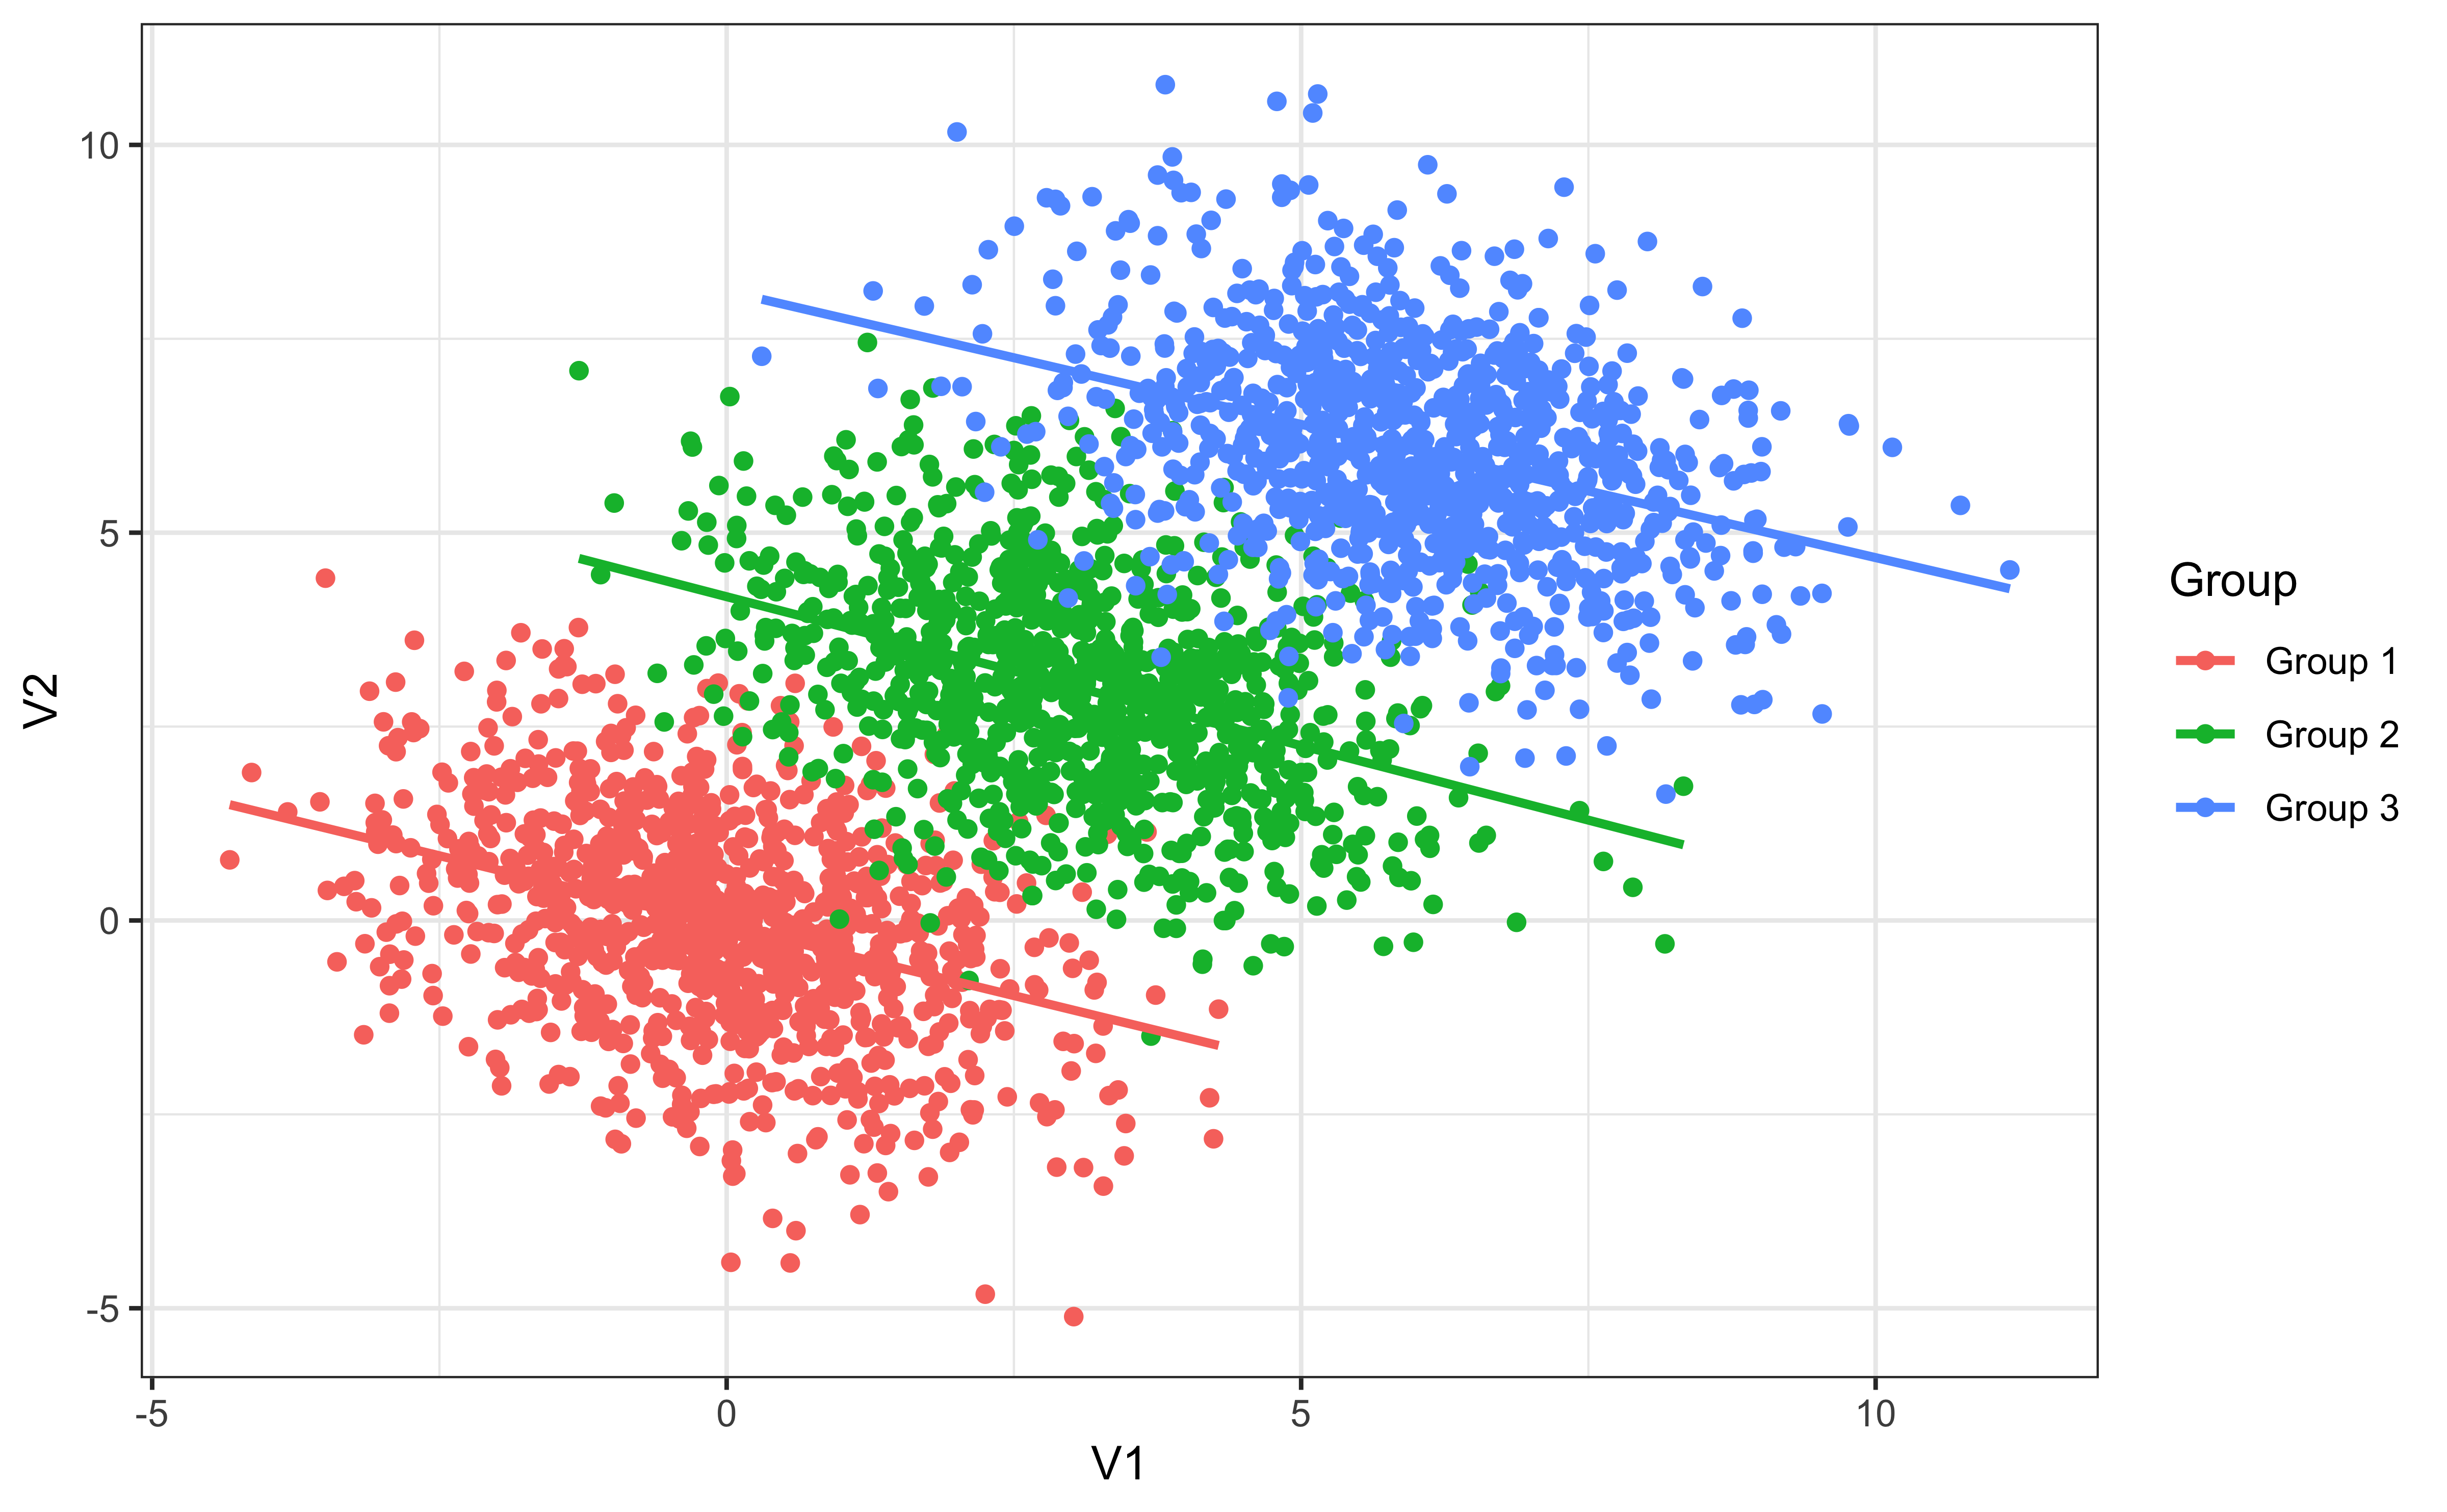
A trend or result that is present when the data is put into groups that reverses or disappears when the data is combined
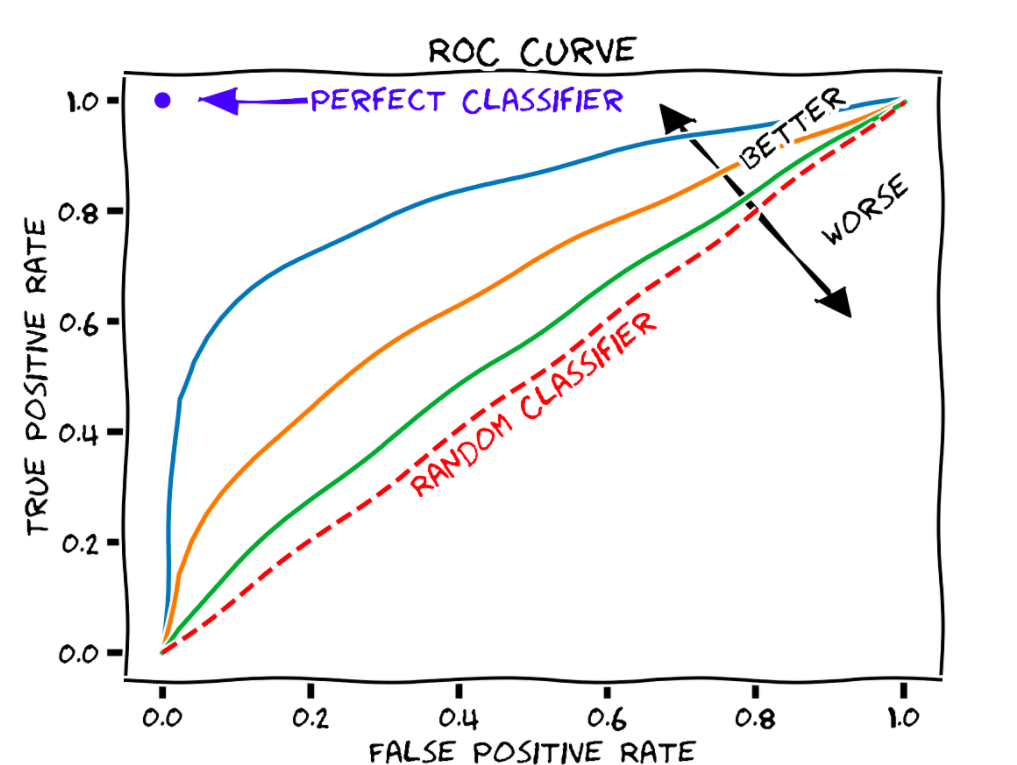
We visualize to understand our models and their performance

You create a SUPER AWESOME visualization

And the reaction you get is…

Which makes you feel like

Who cares, right?

You MUST care about your different audiences

- Readers who land on your may not have the same luxury of developing and answering questions like you did
- Your audience wants to know the story, conclusions, and/or results; they don’t want to analyze the data - that’s your job!
Visualization for Analysis
- visualizations for you and your team
- team and audience knows context
- tool for understanding datasets
- iterate quickly to develop insights
- rough drafts
- can make changes later
Visualization for Presentation
- audience external to you and team
- content is likely new and audience has no context
- designed to communicate useful information
- takes significant more time
- publication ready
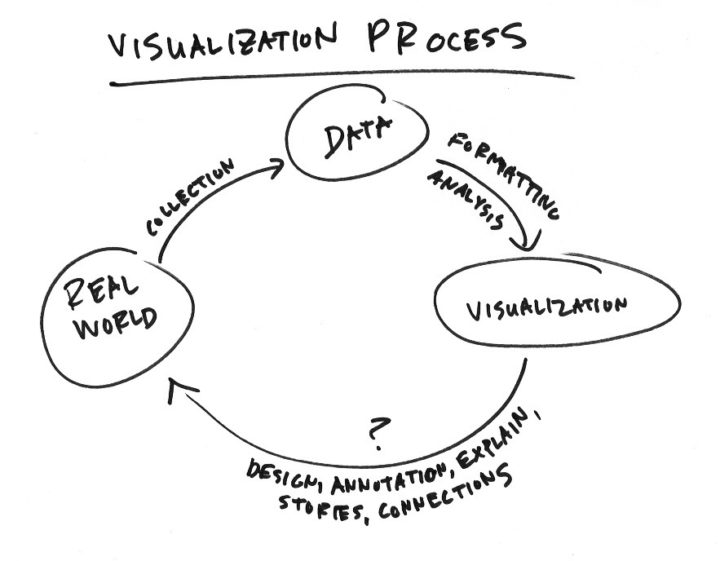
Visualization is an iterative process
Practice, practice, practice


Data <—> Grammar
Data visualization is as valuable to anyone working with data as grammar is to someone working with words
Just as you should not write an essay without proper grammar, you should not create a graph without first mastering data visualization best practices

Some influential figures in data visualization
Nathan Yau
Well-known influencer in the data visualization community, R guru, and creator of FlowingData.

Ed Tufte
Statistician, professor and pioneer in the field of information design and data visualization.


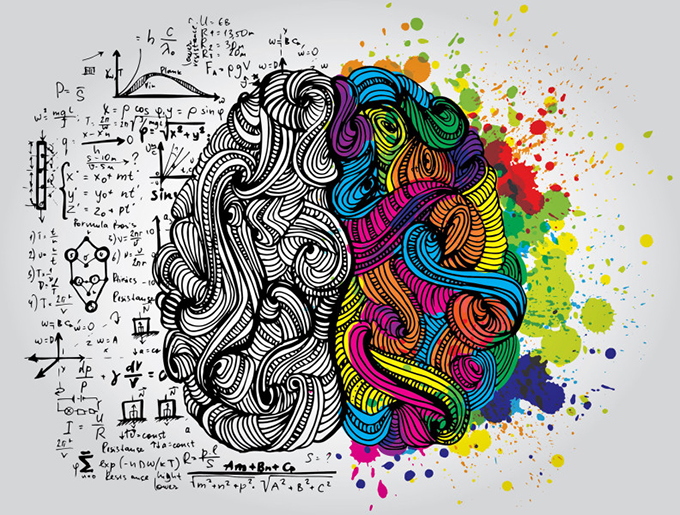
Data visualization is part art, part science
Nathan’s seven rules details
1. Check the data
- This is obvious, if your data is weak, your chart is weak
- Start with simple graphs to see if there are any outliers.
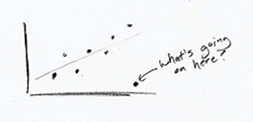
2. Explain encodings
- Don’t assume the reader knows what everything means, graphs should have captions!
- Provide a legend
- Label the marker shapes
- Explain color scale

Nathan’s seven rules details (cont’d)
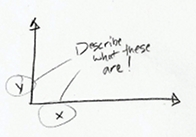
3. Label axes
- Axes without labels or explanation are just decoration
- Describe the scale (incremental, exponential, logarithmic?)
- If possible, have axes values start at zero (don’t omit the base-line)
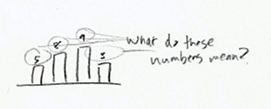
4. Include units:
- Numbers without units are meaningless
- Remove the guesswork
Nathan’s seven rules details (cont’d)
5. Keep your geometry in check
- This is something that is immediately noticeable
- Don’t use area to compare two units unless they are an area. An increase in a unit squares the area.
- Tip: size circles and other 2D shapes by area, unless it’s a bar chart.

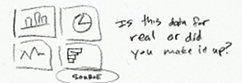
6. Include your sources
- This is another obvious one, always include the source of your data!
- This makes your graphic more reputable and allows others to dig deeper
Nathan’s seven rules details (cont’d)
7. Consider your audience
- What purpose do your charts have and who are they for?
- Avoid quirky fonts
- Make good design choices

Historical context
1994: William S. Cleveland, The Elements of Graphing Data, lists the “basic elements of graph construction” as scales, captions, plotting symbols, reference lines, keys, labels, panels, and tick marks.
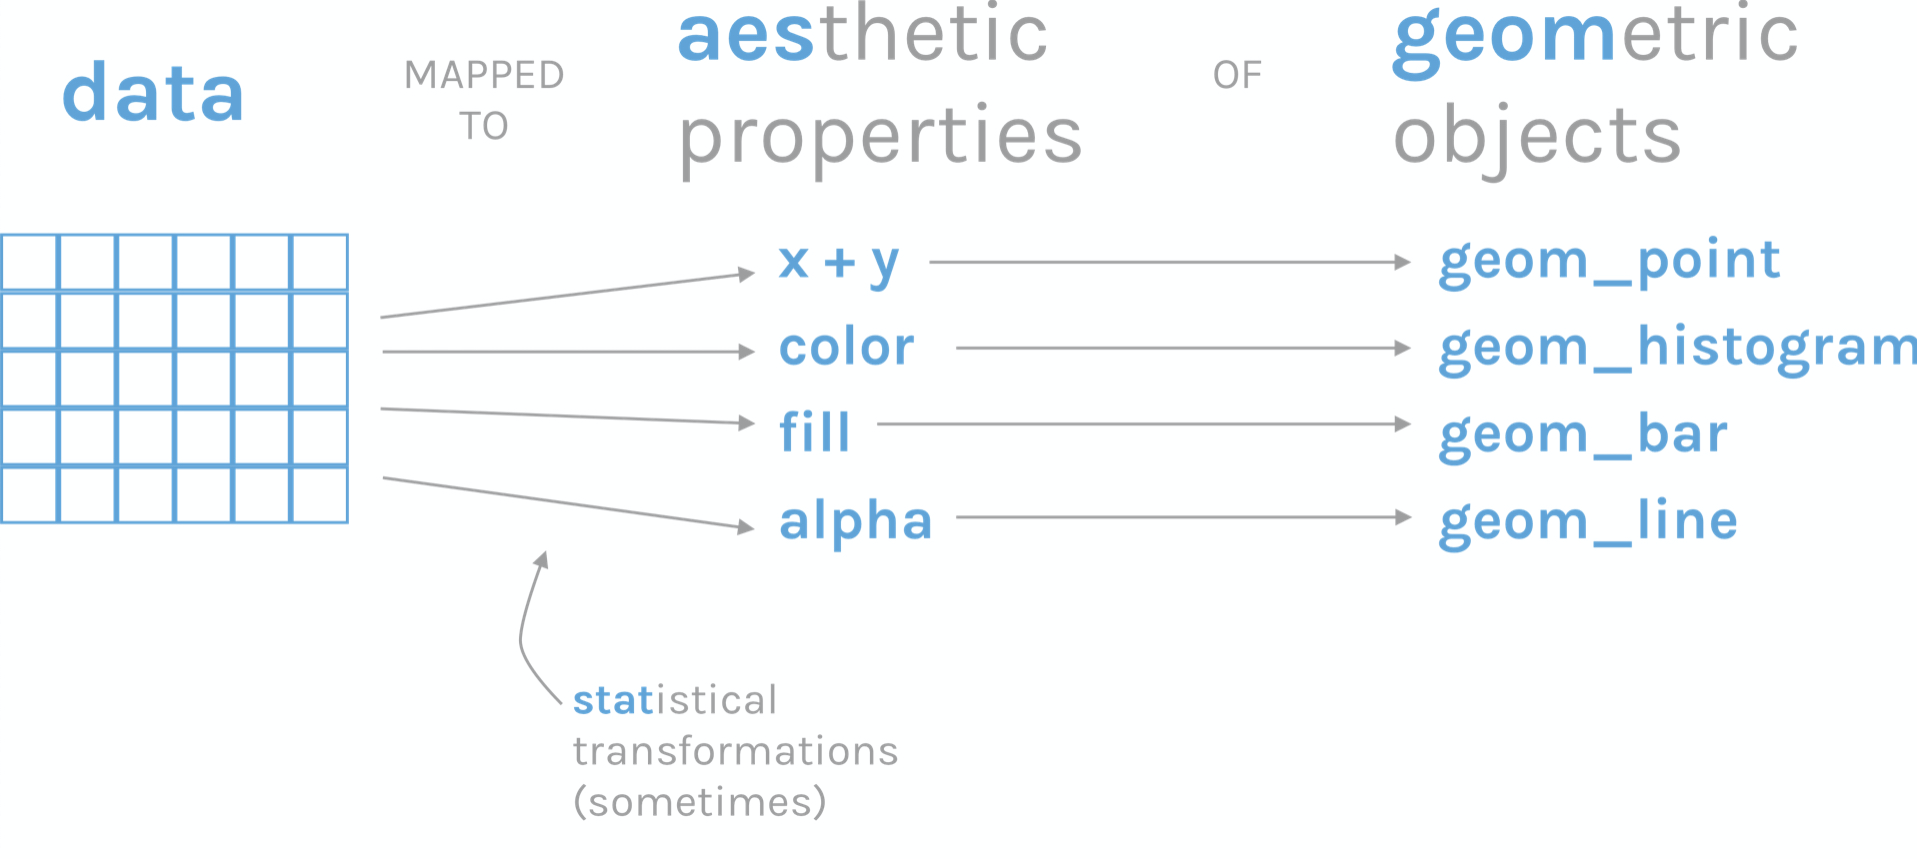
1999: L. Wilkinson’s book The Grammar of Graphics defines ‘components of a graphic’:
- Structured framework utilizing a layered approach to describe and construct visualizations
2009: ggplot2: Elegant Graphics for Data Analysis, Book by Hadley Wickham.
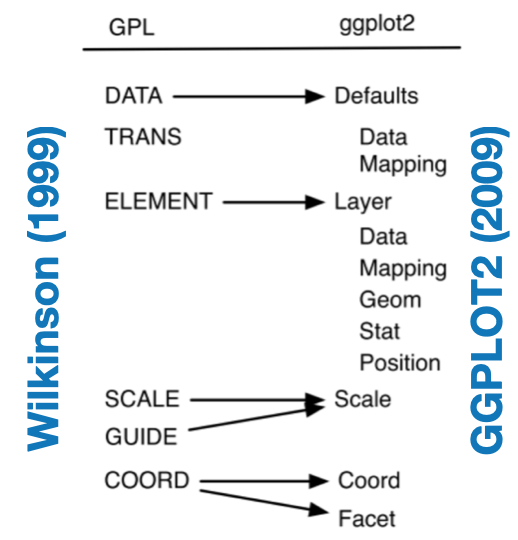
What is it?
- The Grammar of graphics is a conceptual framework for thinking about graphics
- It provides a hierarchy of elements to deconstruct and understand figure design